How we optimized Cassandra cqlsh COPY FROM

Stefania Alborghetti

Introduction
This article is a summary of the changes introduced by CASSANDRA-11053 and the reasons behind them. It demonstrates how performance can be improved from a baseline benchmark of circa 35,000 rows per second to as much as 117,000 rows per second, and describes performance optimization techniques that can be applied to Python programs in general.
In addition to reading this article, you can read this companion blog entry, which describes the practical steps required to take advantage of the techniques described here.
Measuring performance
Before optimization, it is necessary to determine in which areas of code most of the latencies are.
Two profilers were used for optimizing clqsh COPY FROM: the Python cProfile module and the line profiler.
cProfile gives function call execution times and this is very useful to identify functions where most of the execution time is spent. Given one or more functions, line profiler can then report execution times line by line.
The following helper functions were used to start and stop profiling:
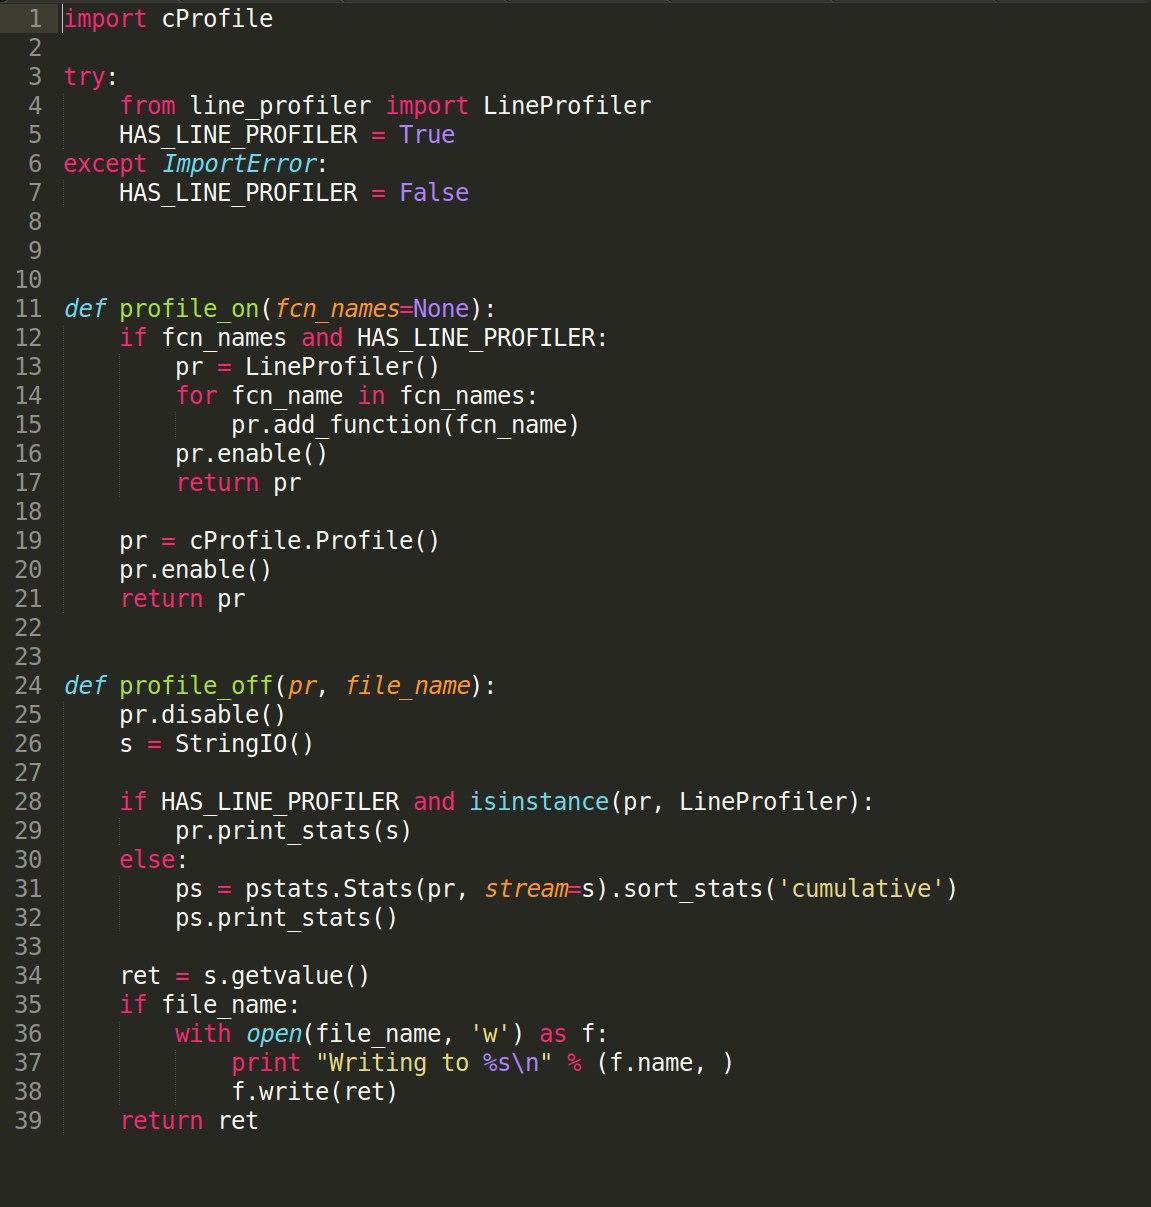
The code for these helper functions is available in this Cassandra source code file.
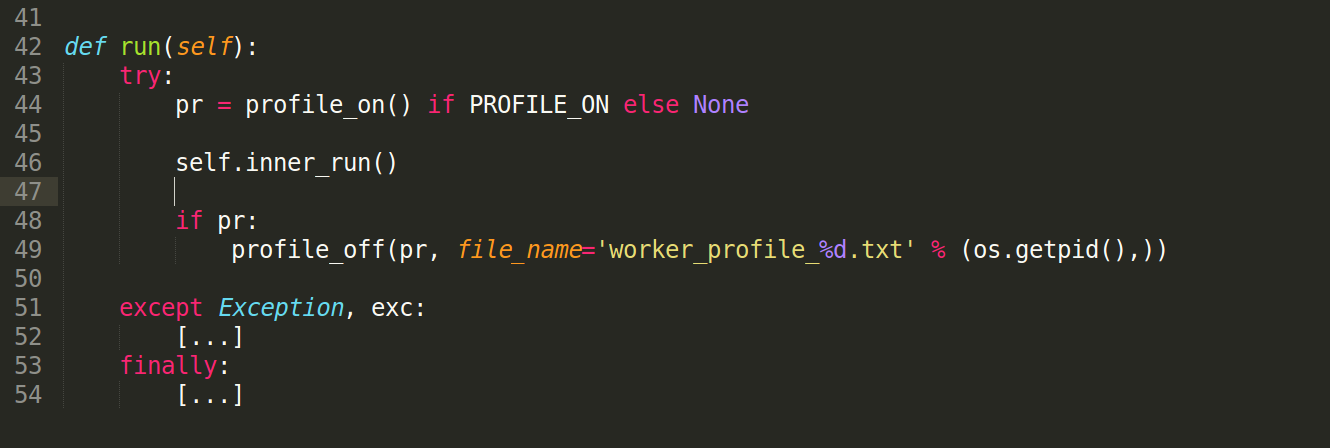
When the line profiler is installed, and if function names are passed to the profile_on() function, then the line profiler is used, otherwise cProfile is used by default. Either way, profile_on() returns an object that must be passed back to profile_off(), along with a filename where the profile results will be saved in text format. For example, given a boolean flag, PROFILE_ON, to indicate if profiling is enabled or not, a high level function can be profiled as follows:
In addition to profiling the code, the Linux strace command is also very useful in determining if significant time is spent on specific system calls, including lock contentions (futex calls). For a given process pid, strace can be attached to a process as follows:
strace -vvvv -c -o strace.out -e trace=all -p pid&
To strace Python child processes that are spawned via the multiprocessing module, you can utilize the process.pid that is available after starting the process:
os.system("strace -vvvv -c -o strace.{pid}.out -e trace=all -p {pid}&".format(pid=process.pid))
A very useful tool to monitor performance on Linux is dstat:
dstat -lvrn 10
This command displays machine parameters such as CPU, disk IO, memory and network activity. The command above updates information every second, and it creates a new line every 10 seconds. Sample output:

The --procs-- and --total-cpu-usage-- sections are particularly useful: too many blocked (blk) tasks are bad and indicate the CPU cannot cope. However, you are aiming at minimizing the CPU idle time (idl) so as not to waste CPU cycles that are available. Other informative sections are --io/total-- and --net/total--, which indicate disk and network activity respectively. Finally, the --system-- sections display interrupts and context switches.
What we optimized
In cPython, the global interpreter lock (GIL) prevents native threads from executing Python byte-code simultaneously. As a consequence, introducing multiple threads does not aid performance and in fact the GIL overhead degrades it, especially on multiprocessor systems.
In order to scale Python programs running in cPython and other Python implementations with a GIL, such as PyPy, it is necessary to spawn child processes. This is relatively simple to accomplish via the Python multiprocessing module: the API of this module is designed to be similar to the threading module, but it applies to processes rather than threads.
For example, locks are implemented with POSIX semaphores on Unix, which can synchronize processes. Additionally there is support for shared memory and interprocess communication via pipes. Be mindful of the fact that the implementation of this module on Unix and on Windows is quite different in capabilities. If supporting both Unix and Windows, it is beneficial to be aware of the significant differences that exist on Windows due to the absence of os.fork().
COPY FROM is implemented using the following processes:
Parent process
This is the original cqlsh process, and its responsibilities include receiving results, displaying the progress report, and terminating other processes when the operation completes.
Feeder process
This is a unique process that reads data from disk, splits it into chunks and sends it to worker processes. The reason there is a unique feeder process is to support parameters such as the ingest rate, skip rows and max rows, which determine how fast data should fed to worker processes, if rows need to be skipped at the beginning of the data set, or if import should terminate after a maximum number of rows.
Worker processes
These are the processes that perform the actual import of the data. By default, there is one process per core, except that one core is reserved for the combined feeder and parent processes.
In the initial optimization of CASSANDRA-9302, the feeder process did not exist and the parent process was performing all the reading and csv decoding. In CASSANDRA-11053, the feeder process was introduced and csv decoding was moved to worker processes. This improved performance significantly as the parent process was previously a bottleneck. It also resulted in real-time progress reporting becoming more accurate, since the parent process is no longer dividing its time between receiving results and sending more work.
Another important optimization introduced was to reduce the number of results sent from worker processes back to the parent process. By aggregating results at the chunk level, rather than sending results for each single batch, the unloaded worker processes were available to increase decoding and data throughput.
Initially, communication across processes was implemented via the Queue class of the Python multiprocessing module. Whilst this is very convenient to use, on Unix it is implemented via two non-duplex pipes, guarded by a bounded semaphore, and with a thread to queue messages. The single pipe was a source of lock contention amongst worker processes. Performance improved by replacing this queue with a pool of pipes, so that each worker process has a dedicated channel to report back results and to receive work. As a consequence, there is now one channel per process. The downside is that the parent needs to monitor all incoming channels. On Unix this is easy to do via a select call, but on Windows this is not available for pipes, and therefore every single channel must be polled for a short period of time.
All Python performance recommendations that are described here were extremely useful. Replacing a built-in call, a bisect_right, on Python types with the same call on the built-in Integers that were wrapped by the Python types, improved the speed of execution of this call for 1 million entries from 2.2 to 0.4 seconds. The test code is available here.
Python name lookup is another source of delays on critical paths; the Python interpreter takes time to lookup references to functions, and storing function references in a local variable before entering a loop reduced latency in critical path methods.
Results
This benchmark was tested with COPY FROM running on an Amazon R3.2XLARGE virtual machine and Cassandra running on 8 I2.2XLARGE virtual machines.
Initial benchmark performance
Initial performance was about 35,000 rows per second for the 1 kbyte test case, where each partition is of approximately 1 kbyte in size and all partition and clustering keys are unique. The partition key is of type TEXT, the clustering key is BIGINT and there is a single data column of type TEXT.
“out-of-the-box” final performance
Our newly optimized version increased performance to 70,000 rows per second if running cqlsh out of the box.
Python C extensions via Cython
Performance can be increased further to 110,000 rows per second if using a driver built with C extensions, and to 117,000 rows per second if compiling the cqlsh copy module with Cython as well.
The remaining performance recommendations described in this blog post were also applied. Specifically, the effect of running with batch CPU scheduling is about 6,000-7,000 rows per second, and the following parameters were optimized for this specific benchmark by observing CPU usage with dstat: NUMPROCESSES=12 (there were 8 cores on the VM), CHUNKSIZE=5,000.
The tests were performed without VNODES; increasing VNODES has a degrading impact on performance but it can be mitigated by increasing MINBATCHSIZE and MAXBATCHSIZE.
One thing worth noting is that this benchmark only uses very simple types, TEXT and BIGINT. Performance may be significantly lower with complex data types such as date times, collections and user types. For these types, consideration of an optimization of the copy module in cqlsh for Cython may be employed.
For more details on the final results, you can refer to this comment, and the suggested future optimizations described at the end.
More Technology
View All
How to Build a Crystal Image Search App with Vector Search

Knowledge Graphs for RAG without a GraphDB