Pluggable metrics reporting in Cassandra 2.0.2

Jonathan EllisTechnology

Guest post by Chris Burroughs
Starting in 1.1, Apache Cassandra® began exposing its already bountiful internal metrics using the popular Metrics library. The number of metrics has since been greatly expanded in 1.2 and beyond. There are now a variety of metrics for cache size, hit rate, client request latency, thread pool status, per column family statistics, and other operational measurements.
You could always write some custom java code to send these metrics onto a system like graphite or ganglia for data storage and graphing. Starting in Cassandra 2.0.2, pluggable Metrics reporter support is built in.
Setup
- Grab your favorite reporter jar (such as metrics-graphite) and add it to the server's
lib - Create a configuration file for the reporters following the sample.
- Start the server with
-Dcassandra.metricsReporterConfigFile=yourCoolFile.yaml - Happy Graphing!
A config file to send some basic metrics to a single local graphite server once a minute might look like:
graphite:
  -
    period: 60
    timeunit: 'SECONDS'
    hosts:
     - host: 'graphite-server.domain.local'
       port: 2003
    predicate:
      color: "white"
      useQualifiedName: true
      patterns:
        - "^org.apache.cassandra.metrics.Cache.+"
        - "^org.apache.cassandra.metrics.ClientRequest.+"
        - "^org.apache.cassandra.metrics.Storage.+"
        - "^org.apache.cassandra.metrics.ThreadPools.+"
You can specifically include or exclude groups of metrics. For example, detailed per column family metrics for a cluster with a single column family might be useful, while excluding them to avoid overwhelming the graphing system might be preferable for a cluster with hundreds of column families. See the metrics-reporter-config library for all of the configuration details.
Example Graphs
Data Load

A simple stacked graph showing the amount of data stored in a cluster growing over the past month. Presumably new nodes will eventually be required if the trend continues.
Read Latency

Troubleshooting 95th percentile latency on a node that clients detected erratic behavior on. The top blue line is coordinator latency, while the bottom line is latency for satisfying read requests within this node's range. The lack of correlation between the two implies the problem causing the large blue spikes lies elsewhere in the cluster and not with the coordinator that happens to be receiving client requests (or at the least that the problem does not have to do with local IO).
Cache Size
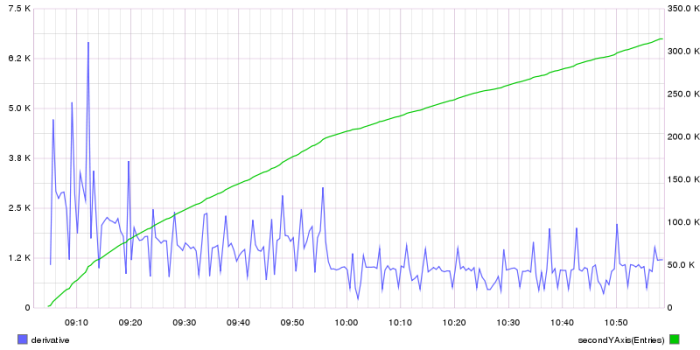
For a newly bootstrapped node, both the number of entries in the RowCache and the graphite calculated derivative showing growth rate.
More Technology
View All
Tips and Tricks for the DataStax Astra CLI

How to Build a Crystal Image Search App with Vector Search