A New Feature of the DataStax C# Drivers: Metrics

João Reis

On October 30, we published a new version for both DataStax C# drivers, version 3.12.0 of the DataStax C# Driver for Apache Cassandra™ and version 2.9.0 of the DataStax Enterprise C# Driver, that includes the latest metrics feature. This blog post will help you quickly get started with this new feature.
Getting Started
Metrics are disabled by default. To enable this feature, client applications need to provide a metrics provider implementation. DataStax offers an implementation based on App.Metrics, but you can also implement your own metrics provider and plug it in.
In this post, I’m going to show you how to run a simple console application that exports the driver metrics to Graphite using our extension based on App.Metrics and how to set up a Grafana dashboard that queries the driver metrics on Graphite. To set up Graphite and Grafana you will need Docker.
You will also need a running Cassandra-compatible cluster. I’m running a cluster locally so I’ll be using the 127.0.0.1 address as a contact point.
Launch Graphite Docker Container
Let’s start by launching a Graphite Docker container to which the driver will export metrics:
docker run -d --name graphite -p 80:80 -p 2003-2004:2003-2004 -p 2023-2024:2023-2024 -p 8125:8125/udp -p 8126:8126 graphiteapp/graphite-statsd
If you are already using port 80, then you need to change the port mapping on the previous command.
Create Project and Install the Required Packages
The snippets here use the .NET Core CLI; you can download the .NET Core SDK here.
First, let’s create a C# console application. The following command creates a project in the current directory so you might want to create a new directory before running this command:
dotnet new console
To get started with the DataStax C# driver for Cassandra in a C# project, install the driver package:
dotnet add package CassandraCSharpDriver -v 3.*
To use the DataStax metrics provider based on App.Metrics, install the extension package:
dotnet add package CassandraCSharpDriver.AppMetrics
The extension package depends on App.Metrics.Abstractions but not the App.Metrics core package, so you will need to install it in your application in order to use this library:
dotnet add package App.Metrics -v 3.2.0
In this example, we will export metrics to Graphite, so let’s install an App.Metrics extension package that integrates App.Metrics with Graphite:
dotnet add package App.Metrics.Reporting.Graphite -v 3.2.0
Configuring App.Metrics
Open Program.cs in your preferred editor and add the following snippet to the Main method:
var metrics = new MetricsBuilder()

    .Report.ToGraphite("net.tcp://127.0.0.1:2003")

    .Build();
The previous snippet configures an App.Metrics’ IMetricsRoot object with the Graphite reporter.
You also need to start the reporter. This can be done using a Task-based scheduler that App.Metrics provides like this:
var scheduler = new AppMetricsTaskScheduler(

           TimeSpan.FromMilliseconds(10000),

           async () => { await Task.WhenAll(metrics.ReportRunner.RunAllAsync()); });
scheduler.Start();
Note that in this example, the reporter is reporting metrics to Graphite every 10 seconds.
Creating a Metrics-Enabled Session
To create a driver session with the default metrics enabled, you can add the following snippet to the Main method in Program.cs:
var session = Cluster.Builder()

            // cassandra running on localhost

            .AddContactPoint("127.0.0.1")

            .WithMetrics(metrics.CreateDriverMetricsProvider())

            .Build()

            .Connect();
And it’s done! You now have an application that is exporting the default driver metrics to Graphite. Just run the following to launch the application:
dotnet run
Note that in this example we haven’t included any code that executes requests. You can add something like this to generate some metrics data:
foreach (var i in Enumerable.Range(0, 20000))

{

    session.Execute("SELECT * FROM system.local");

}
Source Code of This Example
Here’s how the previous code snippets look when put together in a small console application:
using System;

using System.Diagnostics;

using System.Linq;

using System.Threading.Tasks;
using App.Metrics;

using App.Metrics.Scheduling;
using Cassandra;

using Cassandra.Metrics;
namespace DataStaxDemoMetrics

{

    internal class Program

    {

        public static void Main(string[] args)

        {

            //// App Metrics configuration
               // Build metrics root

               var metrics = new MetricsBuilder()

                         .Report.ToGraphite("net.tcp://127.0.0.1:2003")

                         .Build();
               // Build and run scheduler

            var scheduler = new AppMetricsTaskScheduler(

                 TimeSpan.FromMilliseconds(5000),

                 async () => { await Task.WhenAll(metrics.ReportRunner.RunAllAsync()); });
scheduler.Start();
//// DataStax C# Driver configuration
            var session = Cluster.Builder()

                   .AddContactPoint("127.0.0.1")

                    .WithMetrics(metrics.CreateDriverMetricsProvider())

                    .Build()

                   .Connect();


            //// Execute some requests

            foreach (var i in Enumerable.Range(0, 20000))

            {

                session.Execute("SELECT * FROM system.local");

            }

        }

    }

}
If you’re interested in a complete example project that you can leave running while you inspect the metrics that are being exported, head over to the section “Full example project on GitHub” toward the end of this post.
Configure Grafana Dashboard
If you want to inspect the driver metrics with Grafana, you can start by launching a Grafana Docker container:
docker run -d --name -p 3000:3000 grafana grafana/grafana
Open Grafana using the http://127.0.0.1:3000 URL on your favorite web browser. The default username and password are admin. Set up a Graphite datasource using the http://127.0.0.1:80 URL. You might need to select “Browser” access mode, depending on how you are running Docker. You also need to change the datasource port if you mapped another port to the container’s port 80 when you launched the Graphite Docker container.
When adding a query to your dashboard, you can use this as an example of a session metric:
gauge.*.connected-nodes
App.Metrics adds a prefix to the path related to the metric type. Here, * is a wild card for the session name, which you can customize while initializing the driver connection with the Builder (Builder.WithSessionName(string)). If you prefer, you can also use a * as the metric type prefix instead of specifying it since the driver metric names are unique.
Here is an example of a node metric:
gauge.*.nodes.*.pool.open-connections.Value
Here, the second * is a wild card for the node’s address.
I have uploaded an example dashboard to Grafana.com which you can use to test this feature. It uses Timer metrics which are not enabled by default in the driver. To enable all metrics you can do this:
var cluster = Cluster.Builder()

                     .AddContactPoint("127.0.0.1")

                     .WithMetrics(

                         metrics.CreateDriverMetricsProvider(),

                         new DriverMetricsOptions()

                            .SetEnabledNodeMetrics(NodeMetric.AllNodeMetrics)

                            .SetEnabledSessionMetrics(SessionMetric.AllSessionMetrics))

                     .Build();
Full Example Project on GitHub
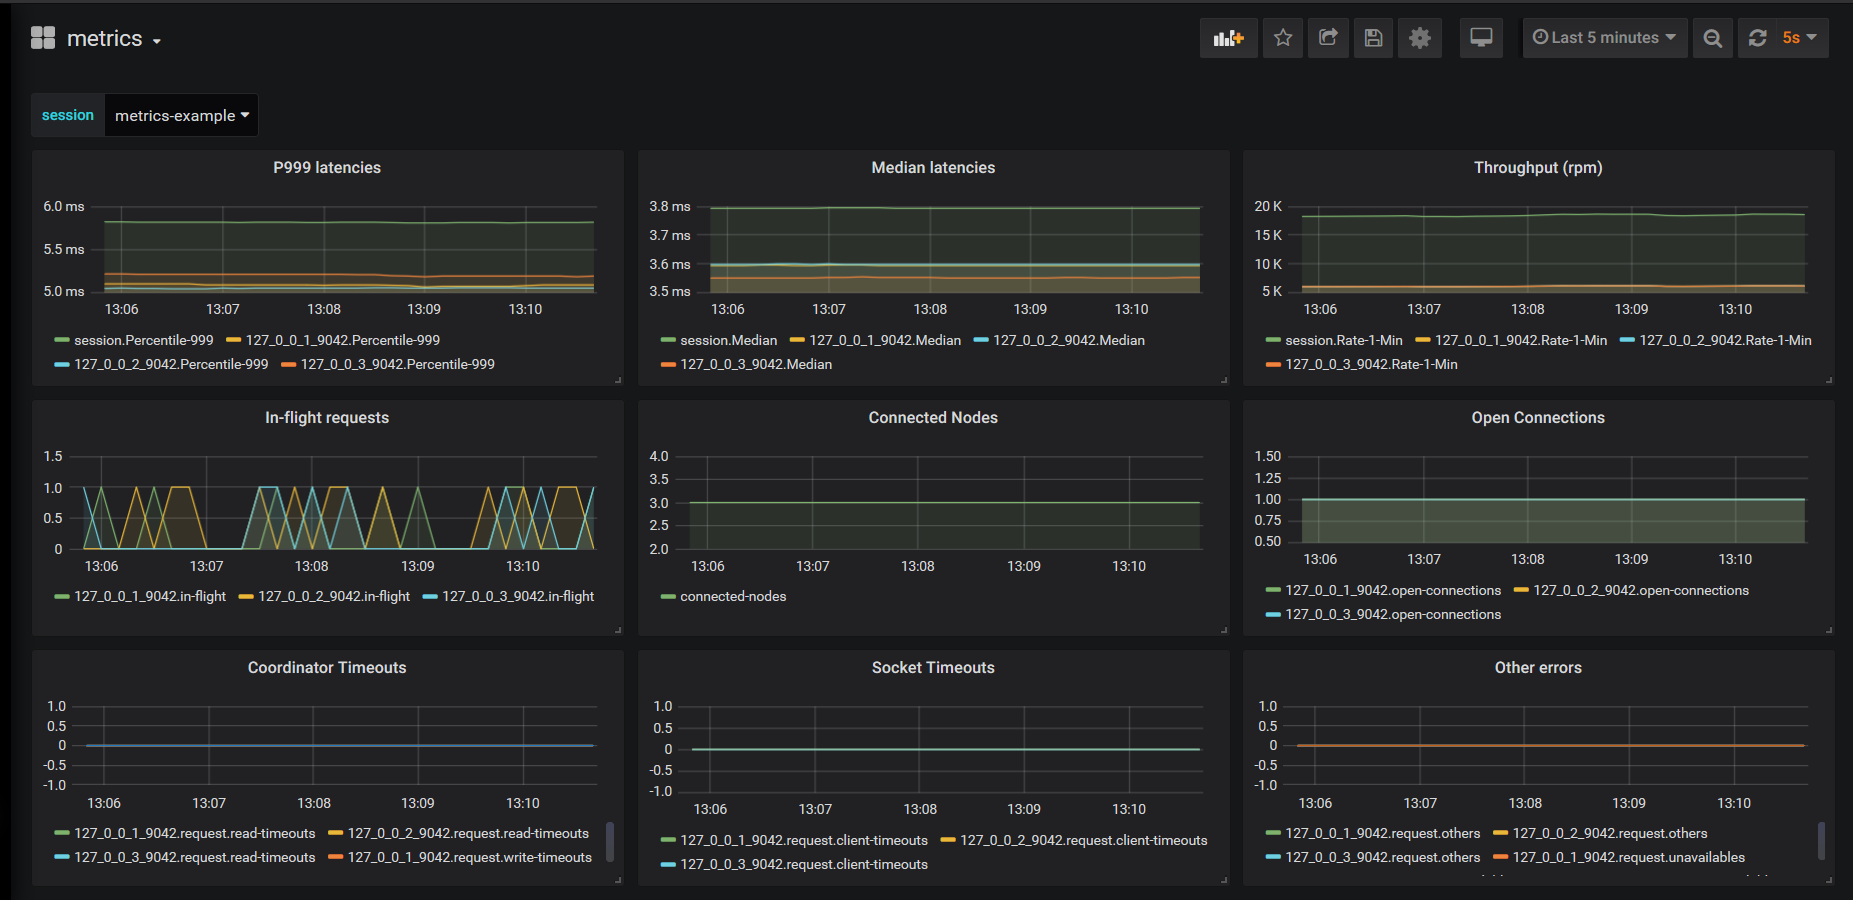
You can find a small example project on the driver’s repository that contains the full source code of a small console application that exports metrics to Graphite while executing requests until the user presses ENTER. It is a useful application to leave running while analyzing the metrics on the Grafana dashboard, for example.
Here is a screenshot of the dashboard I’ve mentioned previously while running this example project:
Acknowledgements
A special thanks to Sivukhin Nikita for kick-starting the discussion and developing a prototype in the initial development stages of this feature which helped us move forward and make this available to everyone in the community.
Wrapping Up
In this post, I showcased a way to use this metrics feature but you can use this feature in a variety of ways with a variety of technologies. You can even implement your own metrics provider instead of using our App.Metrics-based provider.
If you are interested in finding out more about this topic, you can go here to read more about metrics in the DataStax C# Driver for Apache Cassandra and here to read more about metrics in the DataStax Enterprise C# Driver.
More Technology
View All
Introducing the DataStax AI Terraform Module