Visualizing Your Data In Tableau Using DSE 6 Docker Images

Donnie Roberson

Built on the best Distribution of Apache Cassandra. DataStax Enterprise is the always-on data platform designed to allow you to effortlessly build and scale your apps, integrating graph, search, analytics, administration, developer tooling, and monitoring into a single unified platform. We power your apps' real-time moments so you can create instant insights and powerful customer experiences.
Tableau is an industy leading BI too that focuses on data visualization, dashboarding and data discovery. It can be characterized as a "Visual Analytics" application - you don't just use it to visualize data, but instead you conduct analysis through seeing the data in visuals.
So why not utilize the power of Both DataStax Enterprise and Tableau together.
In this simple tutorial we will walk through connecting Tableau to a DataStax Enterprise (DSE) 6.0 Docker Container utilizing DSE Alwayson SQL via the Spark ODBC driver and creating a simple Tableau workbook. We will Utilize DSE analytics to perform the computations, joins and aggregates on the server side (DSE) which is faster and more effecient, while harnesing Tableau to visualize the data.
This Tutorial was created using a DSE 6.0 Docker Container, Tableau Desktop 10.5 running on Windows and Spark ODBC driver 1.2.6.1007.
Prerequisites
- Basic understanding of Docker images and containers.
- Docker installed on your local system, see Docker Installation Instructions.
- A working DSE Docker container running an Analytics workload with the DataStax config volume mounted and the following AlwaysOnSQL/Spark UI ports bound.
- 10000, 7080, 7077, 4040, 9077
docker run -e DS_LICENSE=accept --name my-dse -p 10000:10000 -p 7080:7080 -p 7077:7077 -p 4040:4040 -p 9077:9077 -v ~/config:/config -d datastax/dse-server -k
- Our Docker Images are hosted on Docker Hub. For documentation including configuration options, environment variables, and compose examples head over to DataStax Academy
- A DataStax Academy Account to Download and Install Simba ODBC Driver for Apache Spark: If you do not already have one, visit https://academy.datastax.com/
- A working Tableau Desktop install and basic Tableau understanding.
- You can download a free Tableau trial from https://www.tableau.com/products/trial
The Simba ODBC Driver for Apache Spark
- Download the Simba ODBC Driver for Apache Spark for your version of Microsoft Windows (32bit or 64bit) running Tableau Desktop by visiting https://academy.datastax.com/download-drivers
- Install the Simba ODBC Driver for Apache Spark.
Enabling Alwayson SQL
For advanced configuration management, we’re providing a simple mechanism to let you change or modify configurations without replacing or customizing the containers. You can add any of the approved config files to a mounted host volume and we’ll handle the hard work of mapping them within the container. You actually enabled this feature with the flag -v ~/config:/config when you started your DSE container and we will use it to enable alwayson sql.
You can read more about that feature here.
- Alwayson sql is enabled via the dse.yaml. I have created a custom dse.yaml with the setting preconfigured to use for this demo.
- Download the dse.yaml found here to your docker host machine and place it in the ~/config directory created when starting the DSE container
- If running linux or mac you can run the following command
- Download the dse.yaml found here to your docker host machine and place it in the ~/config directory created when starting the DSE container
wget -L https://raw.githubusercontent.com/roberd13/tableau-dse6-demo/master/DemoData/dse.yaml -O ~/config/dse.yaml
- Restart your dse container so it will pick up the custom dse.yaml and start alwayson sql
docker restart my-dse
Demo Data
- You will need to get the demo data on the DSE Docker Container from here using the following commands
Create directory for the demo data
docker exec -it my-dse bash "/opt/dse/demodata/cqlscript.sh"
Download the script to create the keyspace, table and load the data
docker exec -it my-dse wget -L https://raw.githubusercontent.com/roberd13/tableau-dse6-demo/master/DemoData/cqlscript.sh -O /opt/dse/demodata/cqlscript.sh
Change the permissions to allow execution of the script
docker exec -it my-dse chmod +x /opt/dse/demodata/cqlscript.sh
Download the demo data
docker exec -it my-dse wget -L https://raw.githubusercontent.com/roberd13/tableau-dse6-demo/master/DemoData/videos.csv -O /opt/dse/demodata/videos.csv docker exec -it my-dse wget -L https://raw.githubusercontent.com/roberd13/tableau-dse6-demo/master/DemoData/videos_by_actor.csv -O /opt/dse/demodata/videos_by_actor.csv
- Run the cqlscript.sh script to create the keyspace, tables and load the data using the new dsebulk tool. A Keyspace named killr_video with 2 tables videos and videos_by_actor will be created.
docker exec -it my-dse bash "/opt/dse/demodata/cqlscript.sh"
Now lets Create a Connection to DSE in Tableau
- Lets make sure that AlwaysOnSQL is running
docker exec -it my-dse dse client-tool alwayson-sql status - Open Tableau and create a connection to DSE by selecting Spark SQL under To a Server. You may need to click more to show this option
- Setup your connection by
- Add the ipaddress of the Docker host port 10000 is bound from the DSE container to hosts
- Set Port to 10000
- Set Type to SparkThriftServer
- Authentication to username
- Click Sign in

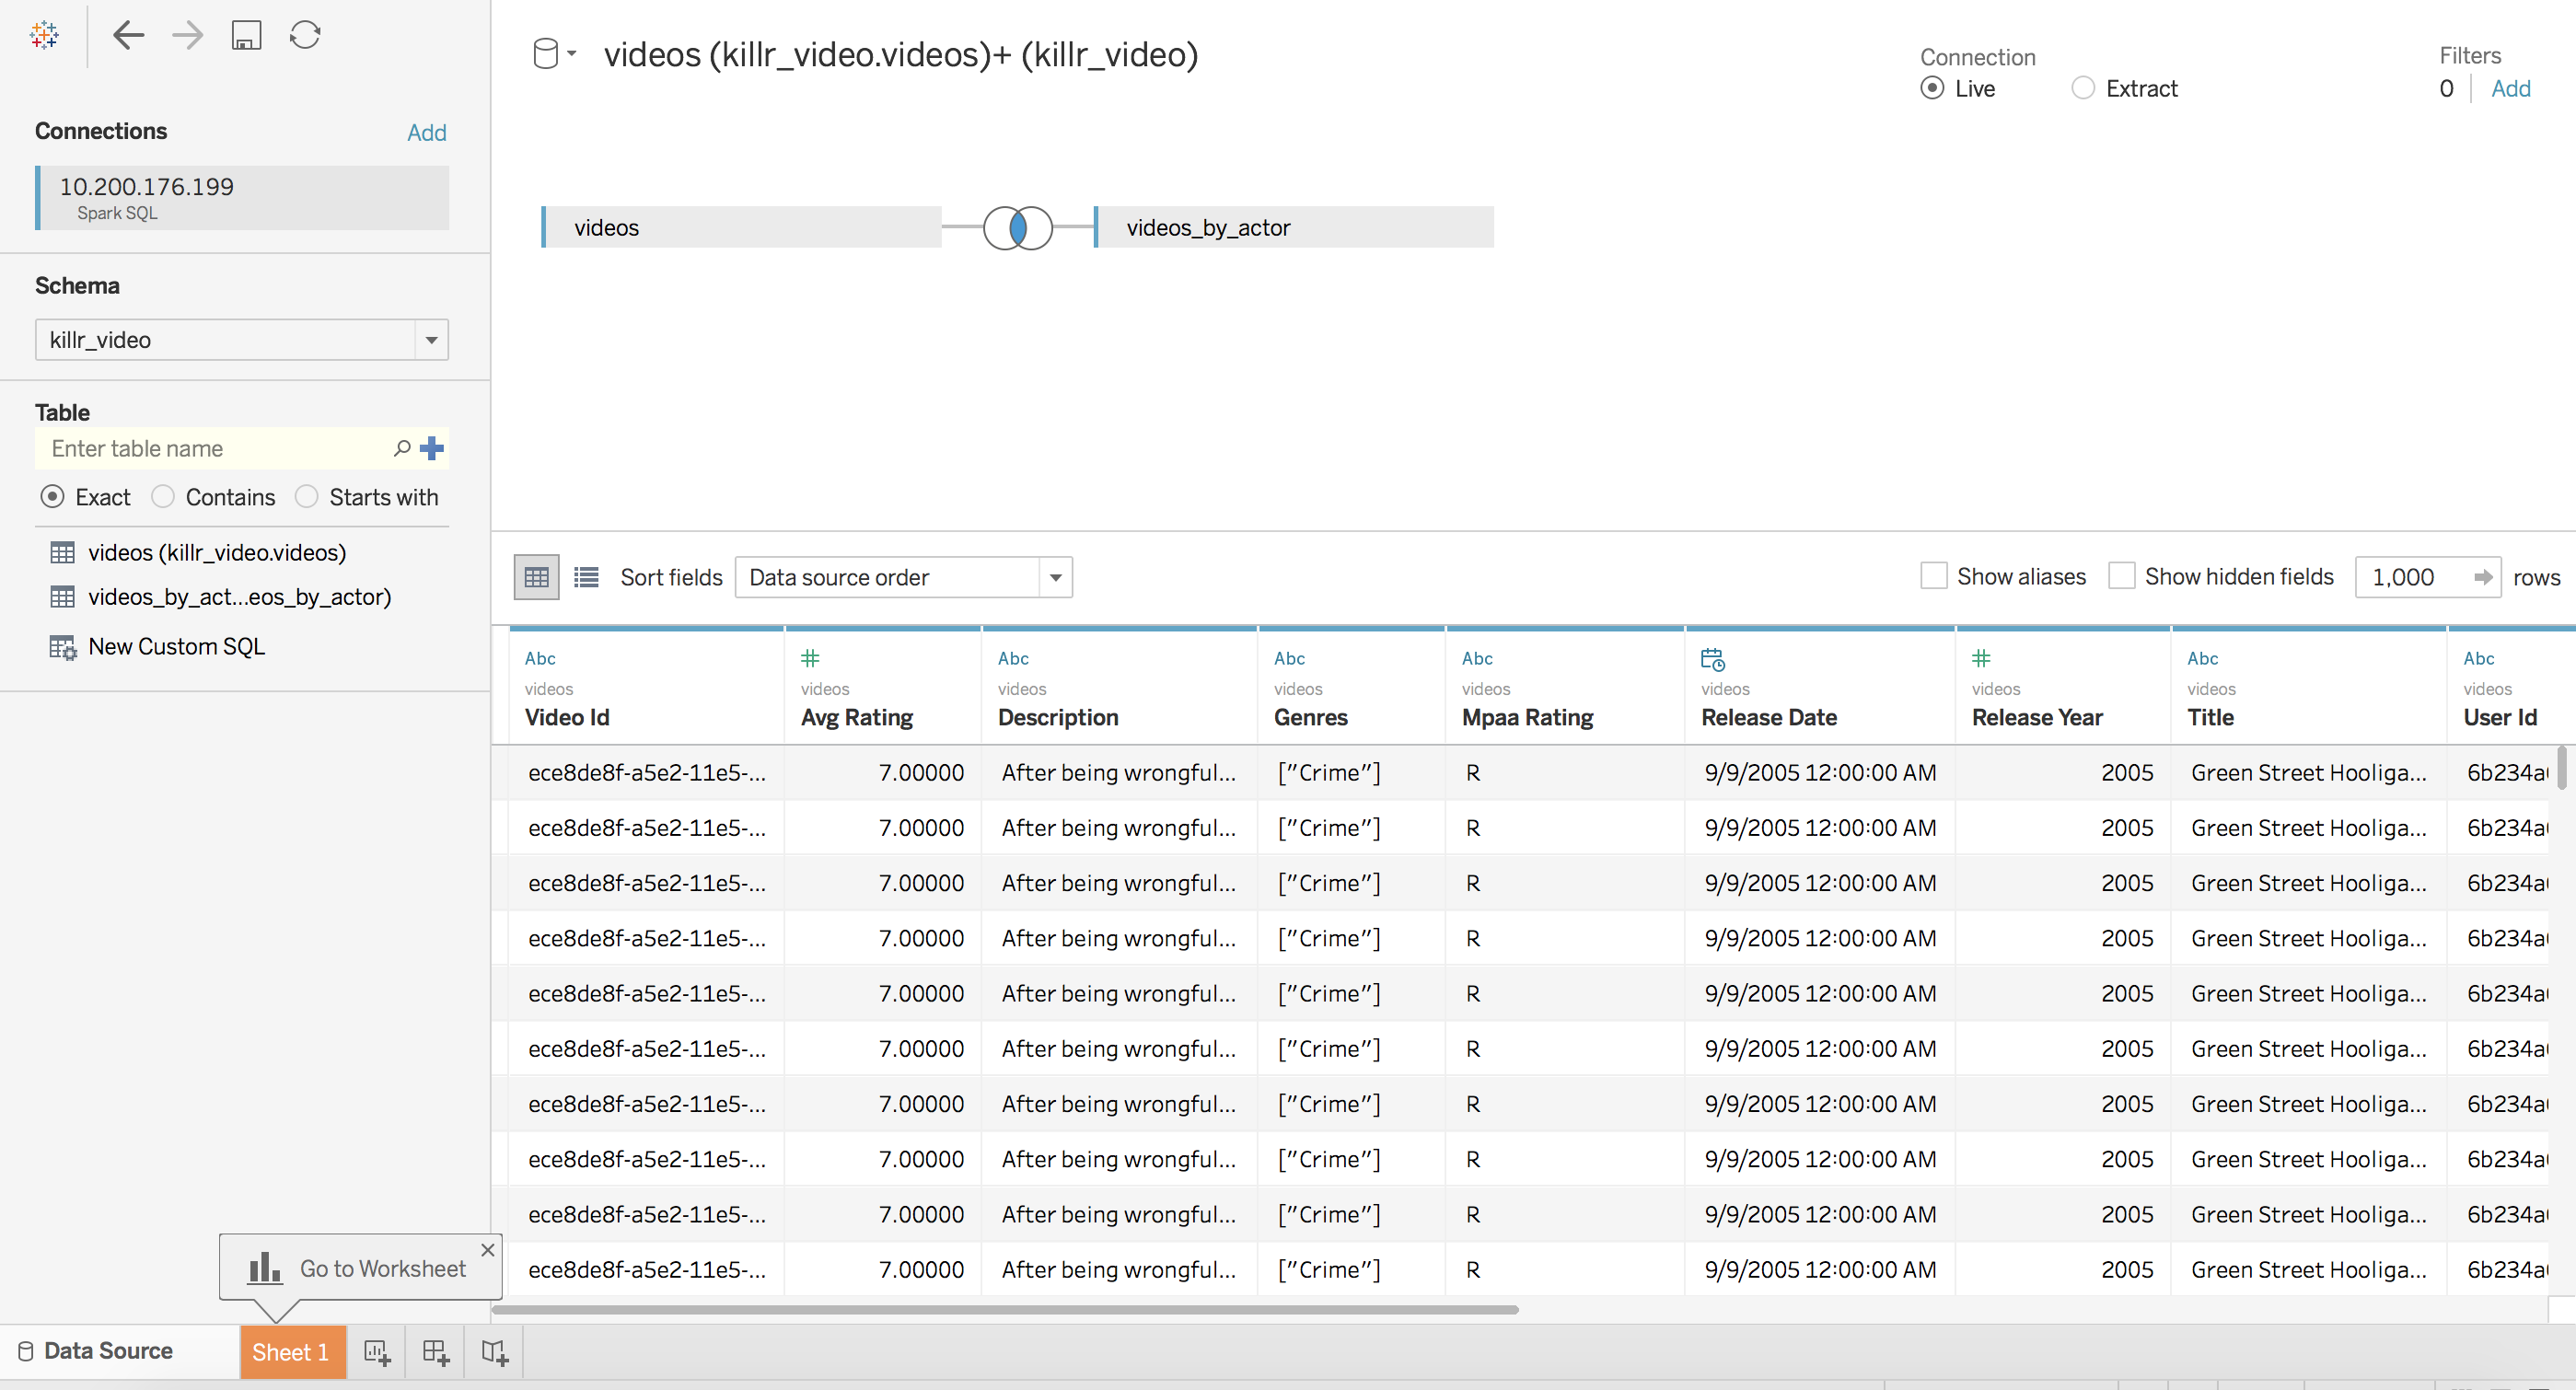
- When your workbook opens after Signing in. On the Data Source tab under connections.
- Search Schema using the drop down and Select Killr_video
- Search Table using the drop down and your tables will be listed
- Drag videos and videos_by_actor to the tables area

- Be sure to keep a Live connection, if you use Extract, all of the data will be loaded into Tableau.
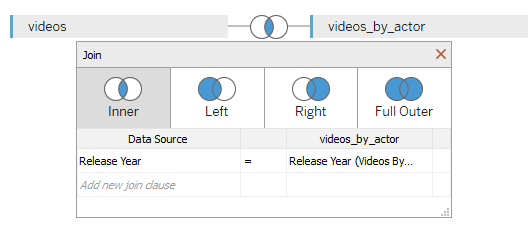
- Create an inner join clause for Release Year = Release Year (Videos By Actor. (click on the blue part of the link between the 2 tables to be able to edit this inner join)
- Click Update Now to see a sample of your data
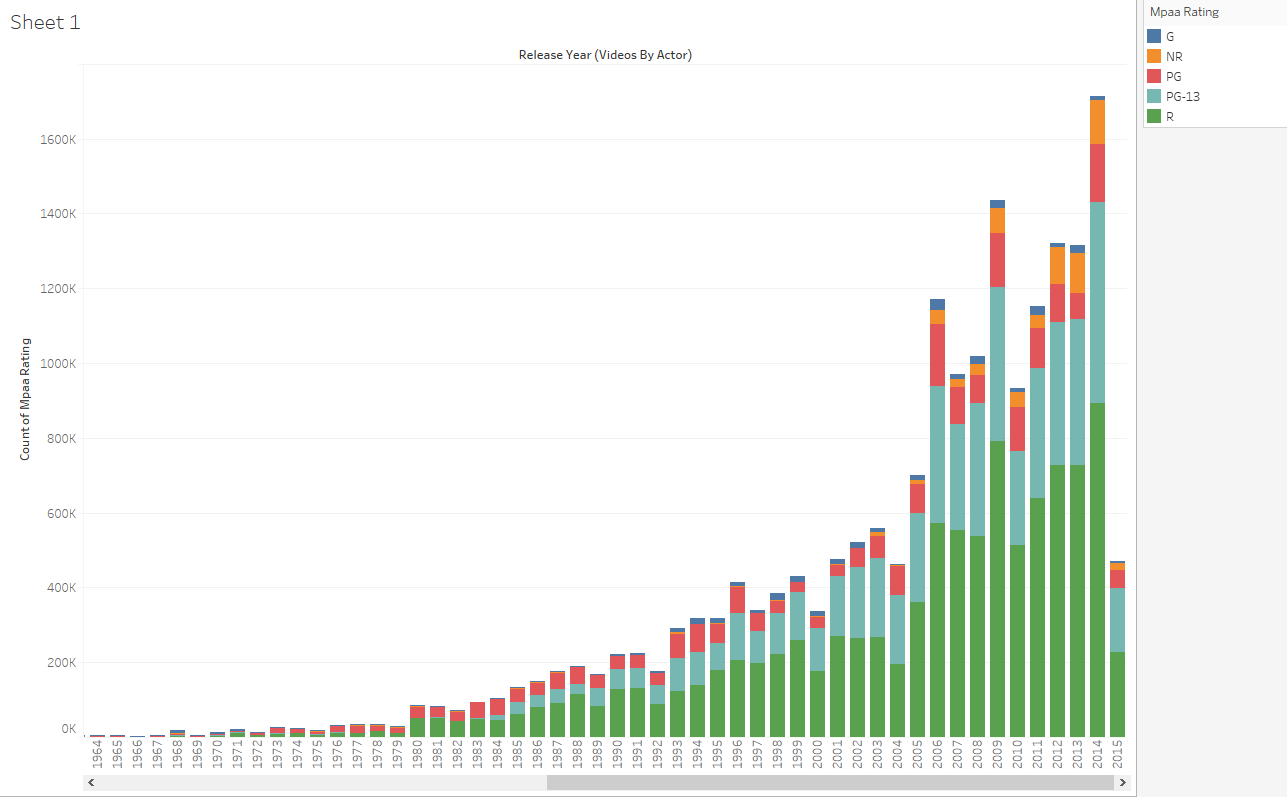
Now Lets See the Count of Movies grouped by Movie Ratings Per Year
- Click on Sheet 1 Tab at the bottom
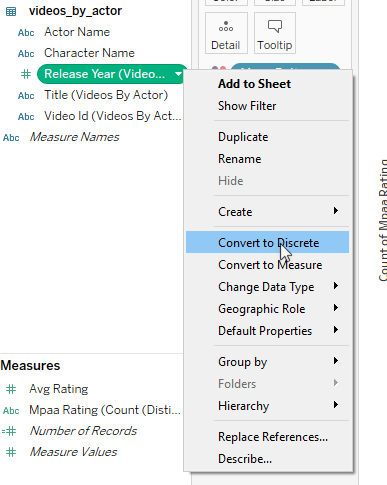
- Convert Release Year (Videos By Actor) to Discrete
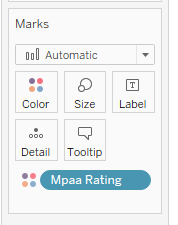
- Drag Mpaa Rating to Color in the Marks section
- Drag Release Year (Videos By Actor) to Columns
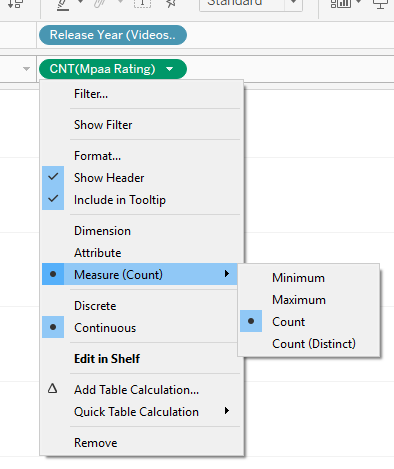
- Drag Mpaa Rating to Rows
- Change the Mpaa Rating under rows to a Count Measure type by using the drop down
- Select Stacked Bar on the Show Me snap on
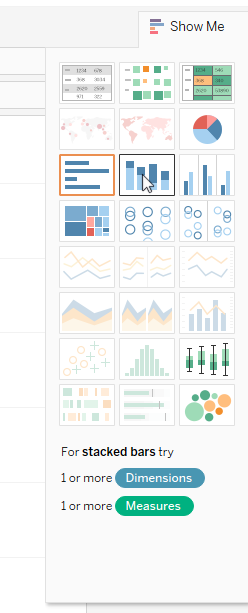
- Click Show Me to hide the snap on
- You now have a color coded graph with the Count of Movies grouped by Movie Ratings Per Year
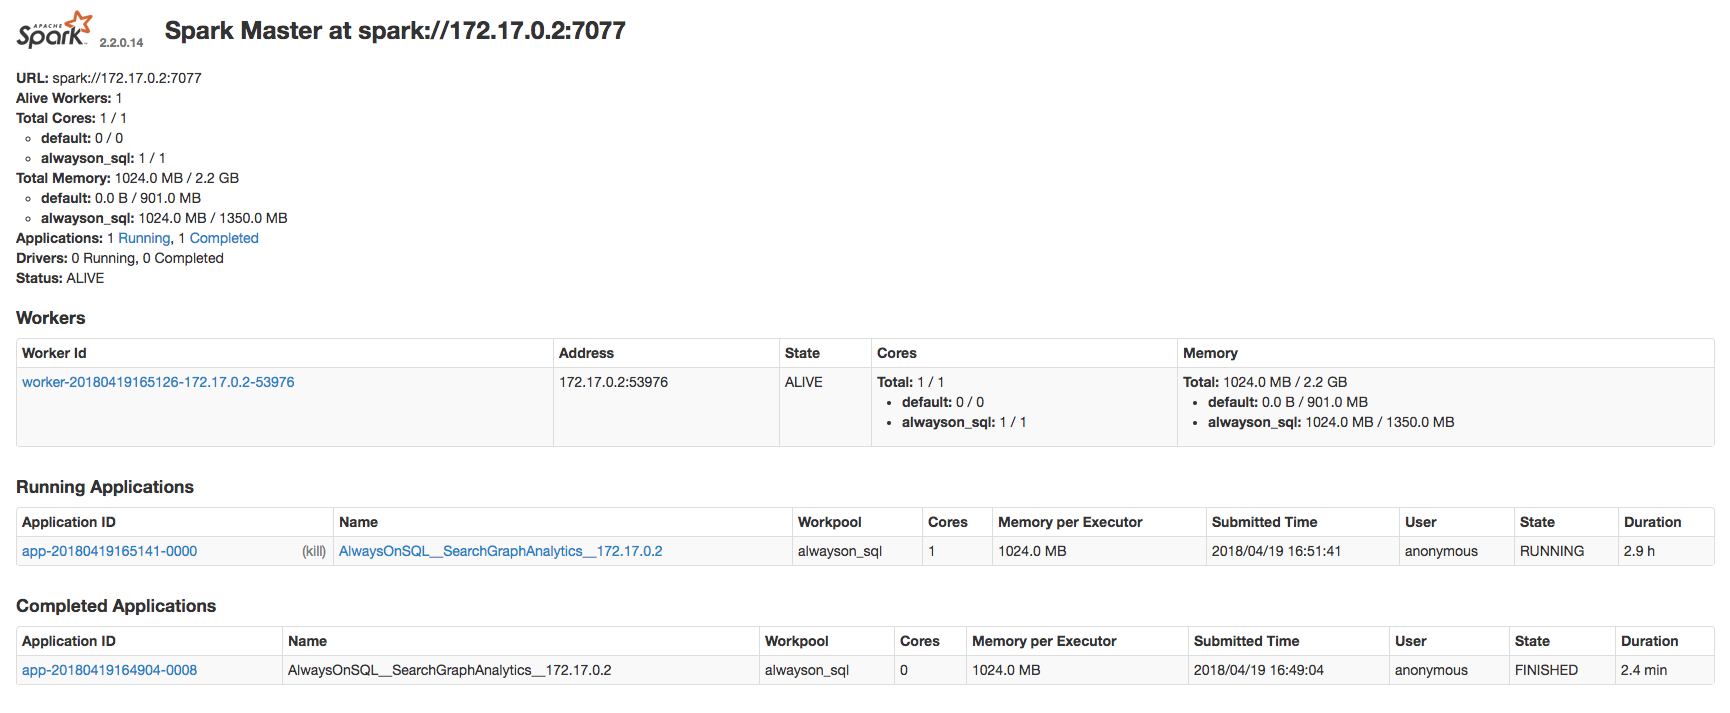
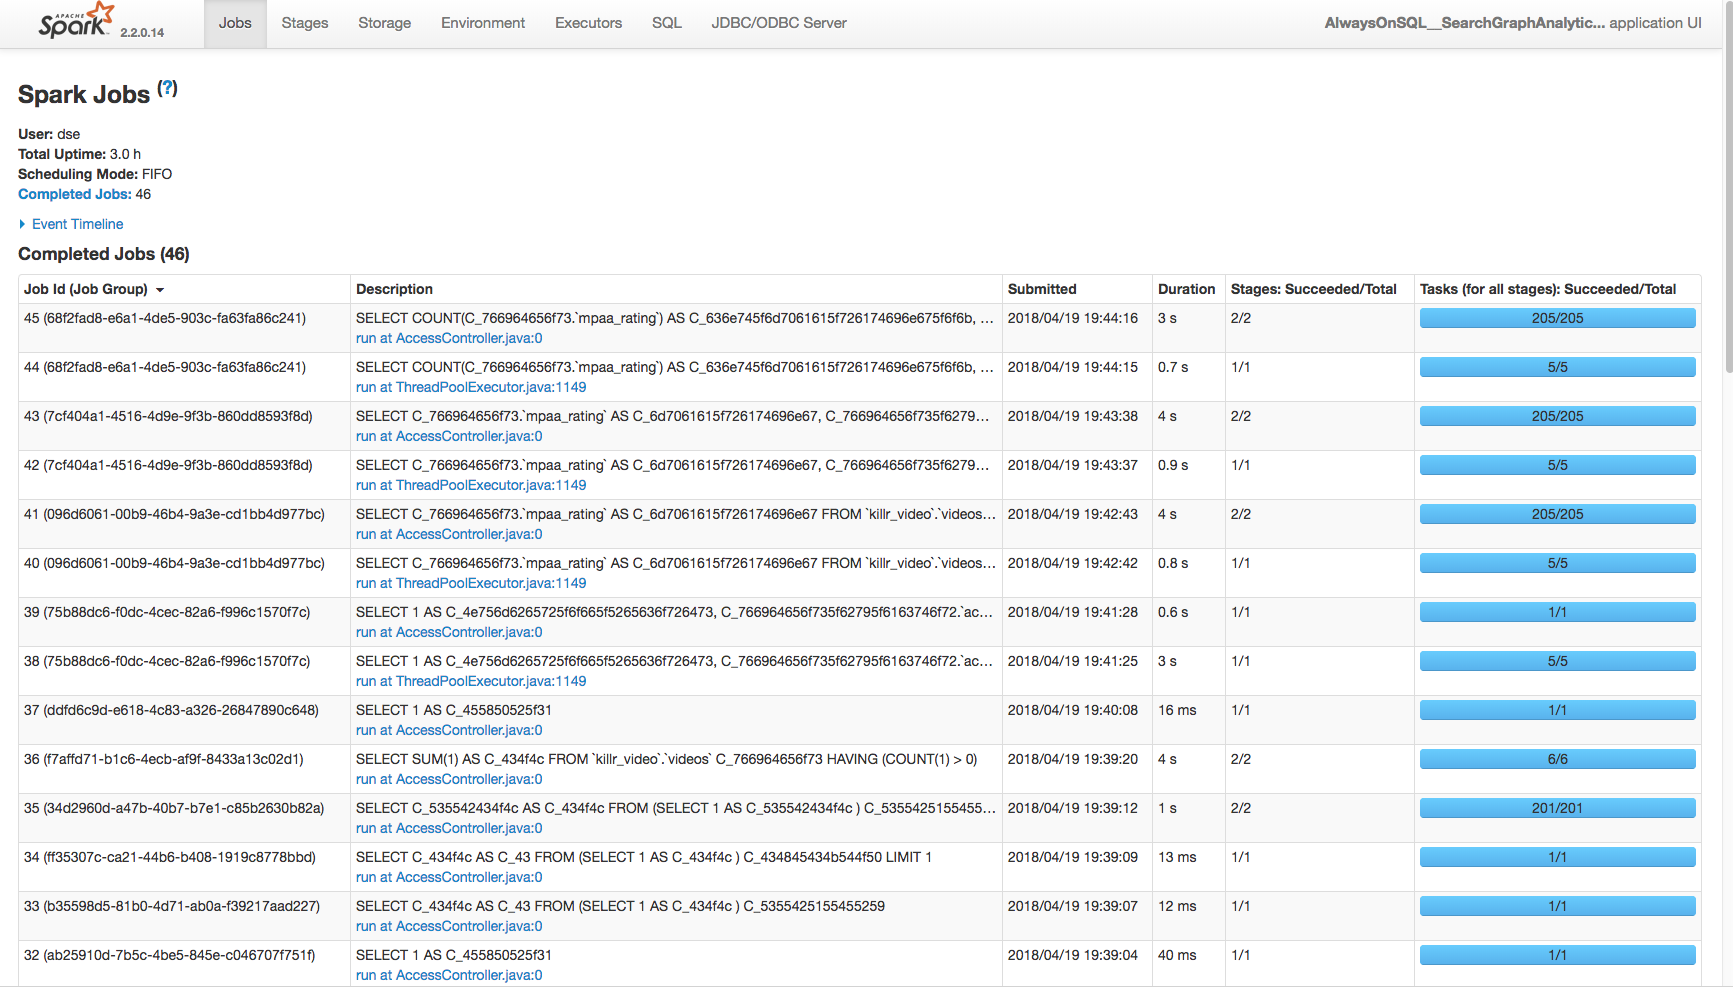
If you are curious what Tableau did under the hood, you can visit http://dockerhostipaddress:7080 which will take you to the Spark Master UI, you can then click AlwaysOnSQL which will direct you to the AlwaysOnSQL Application UI and you can see all of the queries performed during this tutorial.
Master UI
Application UI
More Technology
View All
How to Build a Crystal Image Search App with Vector Search

Knowledge Graphs for RAG without a GraphDB