Monitoring Apache Pulsar’s Health with Pulsar Heartbeat

Ming Luo

Apache Pulsar™ has become a popular choice for high performance pub-sub messaging and data streaming needs. To provide high availability and consistency in a distributed environment, a Pulsar cluster is designed as a multiple tier system. It consists of many components, including Bookkeeper, Broker, Proxy, and Zookeeper.
Monitoring is conducted on individual components of the cluster using Prometheus metrics. This telemetry data provides engineers with insights and visibility into Pulsar system performance and health.
But these metrics are not simple to maintain and passive data can render all sorts of problems in your data. That’s where Pulsar Heartbeat steps in.
This guide will cover the following topics:
- Challenges to monitoring Apache Pulsar health
- What is Pulsar Heartbeat?
- How Heartbeat monitors Pulsar
- Test module features
- Installation and runtime options
- Prometheus alerting options
- Want to try out Apache Pulsar?
Challenges to monitoring Apache Pulsar health
Analyzing Prometheus metrics requires in-depth knowledge of Pulsar domain knowledge. Metrics collected are mostly passive data that is based on workload generated by users.
Example
The message egress and ingress metrics might not indicate the health of individual brokers. With intermittent traffic, it’s difficult to rely on metrics to determine the health of the WebSocket interface.
Limitations like these mean that measuring end-to-end system availability in realtime requires a monitoring application that can generate synthetic workload continuously and across various protocols.
The Pulsar Heartbeat solution
Datastax has developed Pulsar Heartbeat (formerly known as Pulsar Monitor) to fulfill the following requirements:
- Monitor service availability of Pulsar pub-sub protocol, WebSocket, partitioned topic, and Pulsar admin REST interface
- Measure latency over Pulsar pub-sub, WebSocket, and partitioned topic
Astra Streaming has deployed Pulsar Heartbeat in every Pulsar cluster. This enables you to monitor SLA in real time and gain performance insights of end-to-end latency. Pulsar Heartbeat is also shipped with Luna Streaming to help the community and our customers operate their clusters effectively and collect performance data.
What is Pulsar Heartbeat?
Pulsar Heartbeat is an open source project under the Apache 2.0 license. Feature descriptions, configuration instructions, and design can be found in DataStax’s Pulsar Heartbeat GitHub repo.
Pulsar Heartbeat Features and Capabilities
Pulsar Heartbeat monitors Pulsar’s end-to-end:
- pub-sub availability and latency
- partitioned topic availability and latency
- WebSocket availability and latency
It also monitors Pulsar’s:
- admin REST interface availability
- geo-Replication’s availability
- individual broker health
- Kubernetes state
- clusters
Pulsar Heartbeat also:
- integrates with popular DevOps alerting tools
- generates Prometheus metrics
- is an open-source tool written in Go
How Heartbeat monitors Pulsar
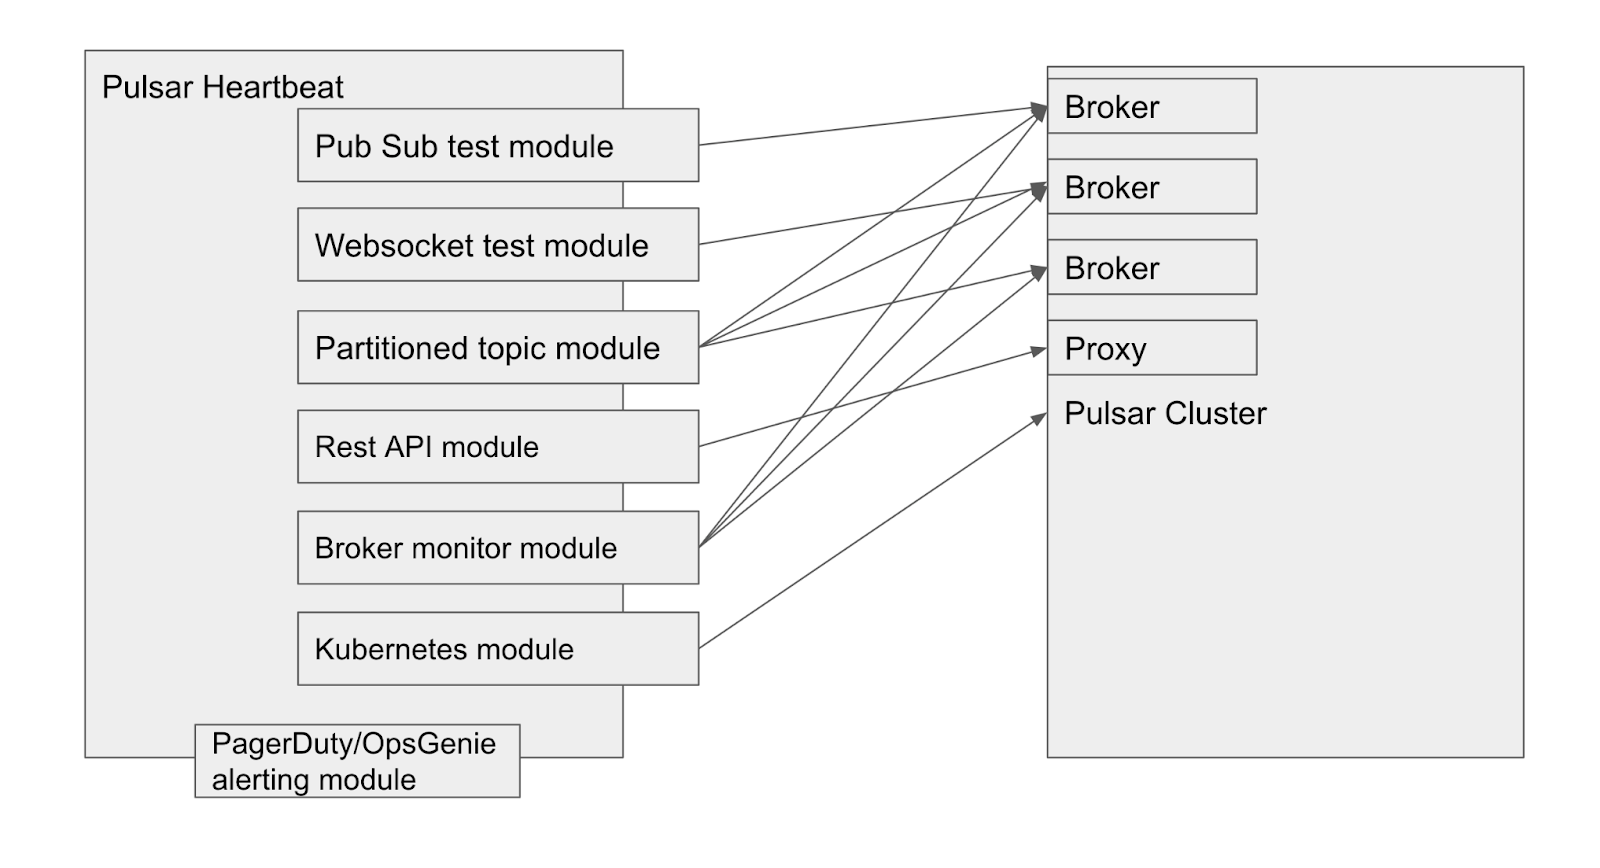
Pulsar Heartbeat monitors system health and a number of pub-sub mechanisms, as illustrated in the diagram above. The specific test module will be described in the following sections.
Pub-sub latency test
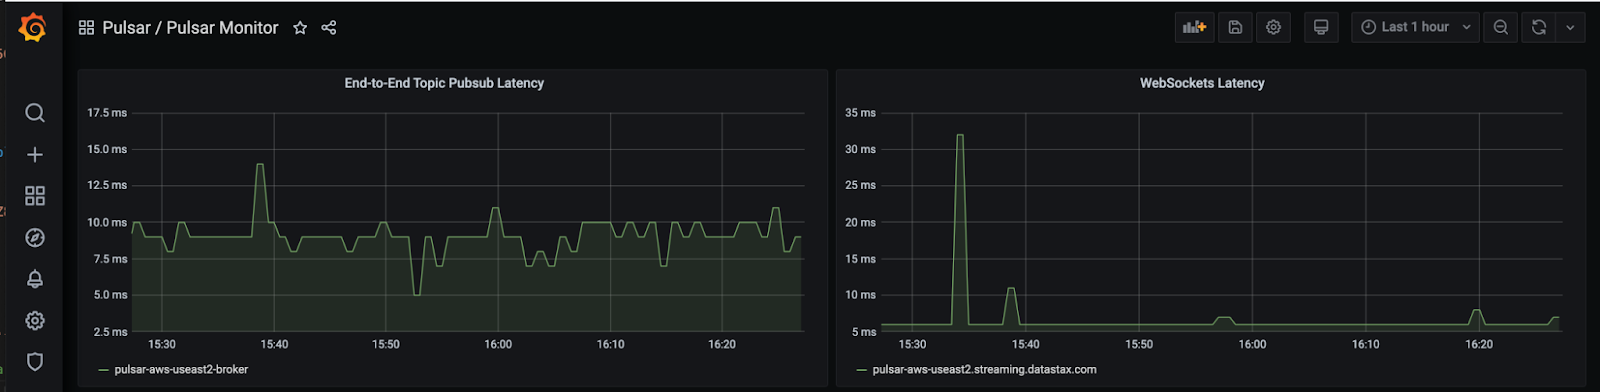
A pub-sub test is used to monitor end-to-end service availability and measure the latency from publishing to receiving a message from Pulsar. To accomplish this, the test sends canary messages to a system topic created for this purpose. The number of messages, payload size, and frequency of the test are configurable.
The test starts with a consumer that expects the arrival of the correct messages in its own thread. Once the consumer is started, a producer sends messages to the topic with a timestamp. Once all messages are received by the consumer, the latency will be calculated based on the time they were sent. Each message is also keyed with an ordered ID that will be used to detect any out of order delivery.
WebSocket test
Pulsar Heartbeat can evaluate WebSocket availability. It sends a message to a topic via the WebSocket URL and expects the same message on the WebSocket consumer URL. It measures the end-to-end latency of the WebSocket pub-sub test.
Partitioned topic test
A single pub-sub test only evaluates the health of a single broker. To test the availability of all brokers, the tool sends a number of messages over a partitioned topic that covers a wide range of them. Pulsar Heartbeat creates a partitioned topic with predefined N number of partitions via the Pulsar admin REST interface. Pulsar Heartbeat starts with the same number of consumers that expect to receive N messages published by a producer. The producer then will send N of canary messages to the partitioned topic. The test not only monitors service availability over a number of brokers, it also measures the latency from publishing the first message to receiving the last message.
Broker monitor
Pulsar has a built-in broker health monitor. It regularly publishes a message to a broker health check topic for validation. The health check topic is a special topic per broker under the Pulsar system tenant. Pulsar Heartbeat uses a Pulsar Reader client to tap into this topic to verify the health of individual brokers. This feature is enabled when the health check is configured as part of the Pulsar broker’s Kubernetes liveness probe.
Pulsar admin REST API monitor
Pulsar has an admin REST interface that manages all important entities in a Pulsar instance, such as tenants, namespaces, and topics. Pulsar Heartbeat monitors admin REST API health by sending HTTP requests to query the tenant list on a predefined schedule.
If the partitioned topic test is enabled, the admin REST interface is also tested by querying the existence of the partitioned topic or creating the partitioned topic in the first test.
Kubernetes deployment monitor
Apache Pulsar’s cloud-native design is a significant competitive advantage. Pulsar can be easily deployed and managed in a Kubernetes cluster. Pulsar Heartbeat can be set up as a Kubernetes deployment in the cluster to discover Zookeeper, Bookkeeper, Proxy, and broker replicas— so it can monitor their availability and alert users when any instances go offline.
To monitor Pulsar instances in a Kubernetes cluster, Pulsar Heartbeat has to be deployed within the same cluster. This feature won’t be supported when Pulsar Heartbeat runs remotely to a Pulsar cluster. For Pulsar Heartbeat to access the Kubernetes API server, a service account with the required access role must be configured.
Test module features
Pulsar Heartbeat’s test modules are data-driven and run independently of each other within their execution thread. Each test’s module can be enabled and configured for connection, verdict, and alert. The configuration can be specified by either a JSON or YAML file.
Pulsar Heartbeat repeatedly runs these tests on a predefined schedule to test the availability of each protocol and measure the latency if applicable.
The basic verdict of these tests relies on successfully publishing and receiving the correct message or messages. In cases with more than one message, the orderly receipt will be verified.
The end-to-end latency verdict is evaluated within a predefined latency budget that is configurable for each test.
Monitor multiple clusters
Pulsar Heartbeat can run remotely to multiple Pulsar clusters. It can perform tests on Pulsar pub-sub, WebSocket, REST interface, and partitioned topics. It also measures end-to-end latency against these tests.
Even if you’re only operating a single cluster, this feature can also be used to factor in network latency to a remote Pulsar client in the standard latency tests offered by Pulsar Heartbeat.
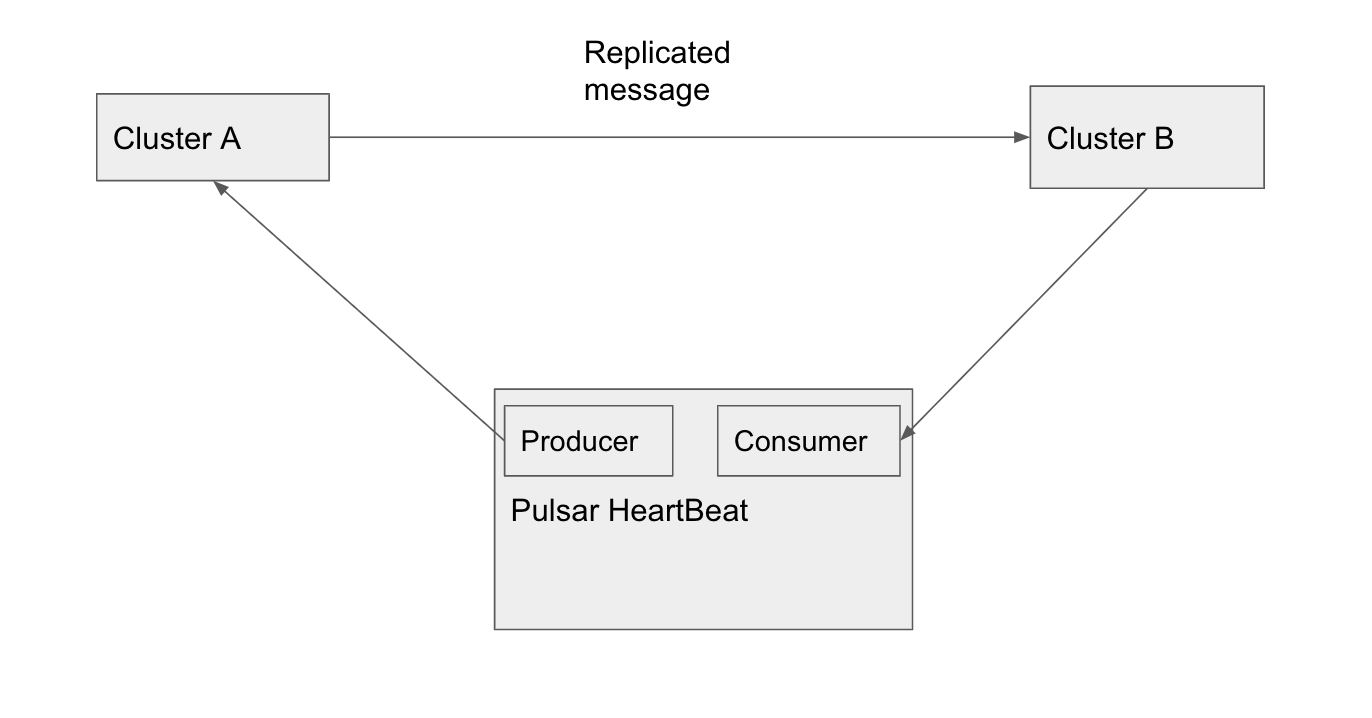
Geo-replication test
Geo-replication is a feature that can replicate messages across multiple Pulsar clusters. This is supported out-of-the-box in Apache Pulsar. Pulsar Heartbeat can orchestrate a test setup to monitor message replication among geo-replicated Pulsar clusters. In the diagram below, Pulsar Heartbeat sends a message to cluster A. The message is replicated to cluster B where Pulsar Heartbeat subscribes to the same topic to validate the received message. It can also measure the end-to-end pub-sub latency for monitoring and performance analysis.
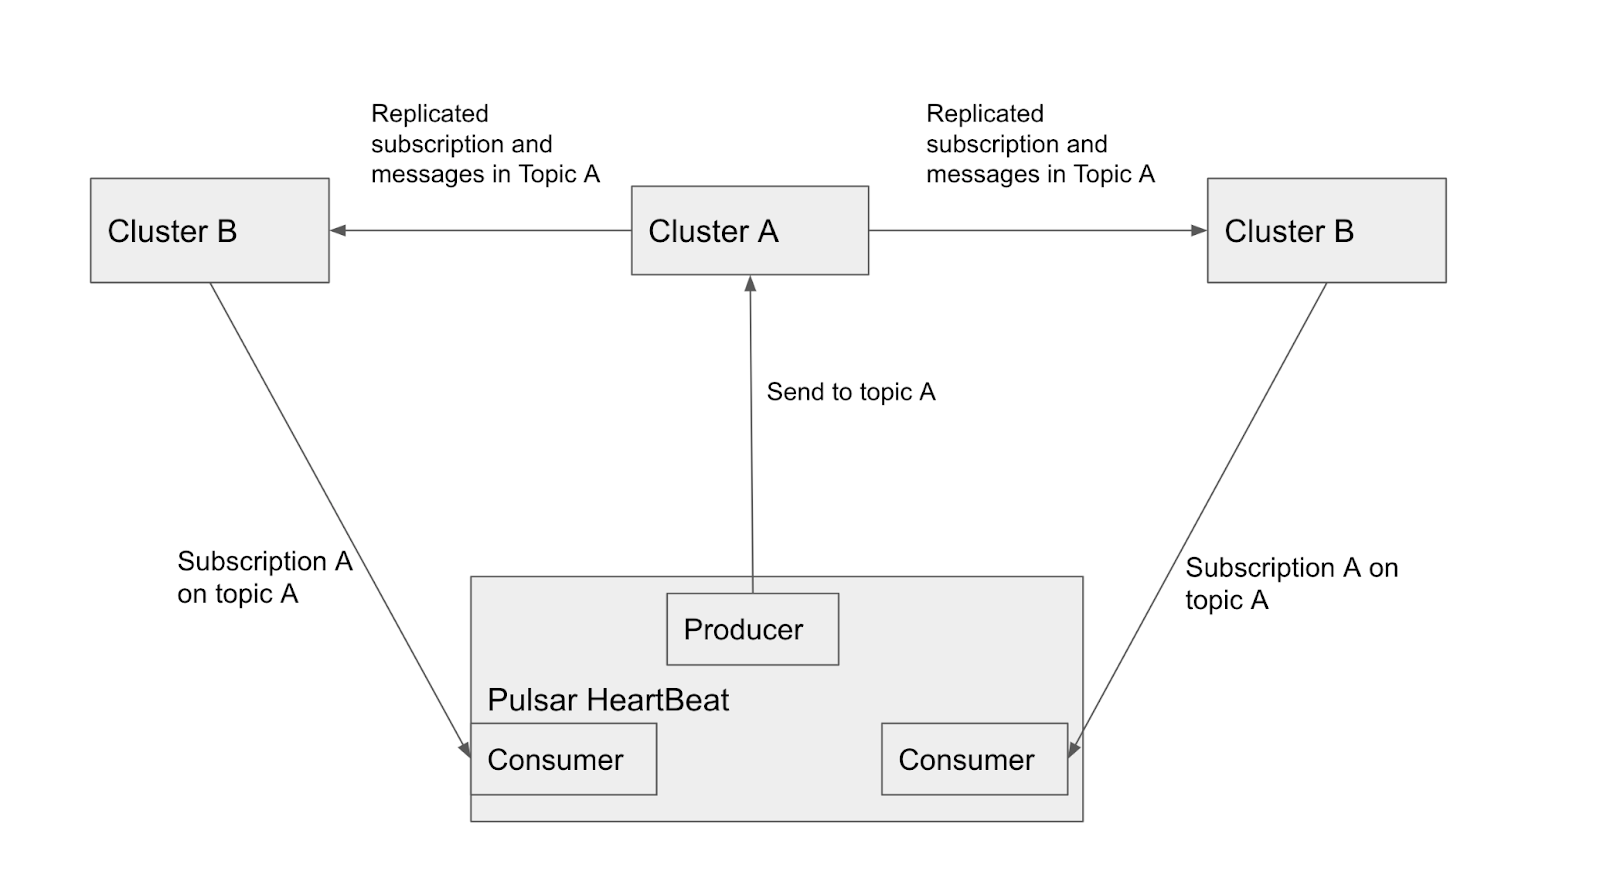
Pulsar Heartbeat can also verify subscription replication in a multiple cluster configuration. A producer sends multiple messages to cluster A. Pulsar HeartBeat creates a consumer to receive a message on another cluster. It repeats the same procedure against the other clusters sequentially to make sure no duplicate messages are received under the same subscription.
Pulsar Heartbeat Configuration
Pulsar Heartbeat tests are data driven by the configuration file. These modules run independently of each other within their execution thread. Each test’s module can be enabled and configured for connection, verdict, and alert. They can be configured by either a JSON or YAML file.
Installation and runtime options
Pulsar Heartbeat has several runtime and installation options.
Build and run as a binary executable
Pulsar Heartbeat is written in Go. So it can be easily built against different OS and architecture targets. Our repo provides a script to build binaries for multiple-supported operating systems and architectures. The configuration file is specified as a command line option that instructs Pulsar Heartbeat how to run the tests and their respective verdict evaluation.
Docker
We can also run Pulsar Heartbeat as a docker container. The configuration file can be persisted on Docker volumes so it’s not reset every time the container restarts. Our repo offers a multi-staged Docker build to produce a small image size. Datastax maintains an official Docker image repo for Pulsar Heartbeat. The image is available for public use.
Did we mention good things can come in small packages? Pulsar Heartbeat’s Docker image has a small footprint of 25MB.
Kubernetes deployment and Helm chart
Pulsar Heartbeat is a stateless application, so it can be deployed as a Kubernetes service. The configuration file is sourced from Kubernetes’ ConfigMaps. A service account is required to access the Kubernetes server API for Pulsar replica-monitoring needs.
Pulsar Heartbeat has been integrated into the Datastax Pulsar Helm chart, as well as Luna Streaming’s replicated distribution. This enables monitoring in a single Helm install.
Prometheus alerting options
Pulsar Heartbeat generates Prometheus metrics that can review real-time and historical end-to-end latency, WebSocket pub-sub latency, and Pulsar Kubernetes pod availability, as well as the Pulsar tenant count.
Alerting
As part of the monitoring service, Pulsar Heartbeat can alert users through its OpsGenie and PagerDuty integration. An alert is triggered by a number of consecutive failed tests. To detect system degradation, an alert can also be generated based on the number of failures (non-consecutive) within a moving window. The number of consecutive failures and the moving window size, in seconds, are configurable.
Fault deduplication
To prevent alert fatigue, Pulsar Heartbeat leverages its OpsGenie and PagerDuty APIs to deduplicate the same type of fault. It can automatically resolve alerts if the system corrects the fault itself. This can be useful when brokers or bookkeepers restart because of upgrades and other planned maintenance activities.
Any test failures are logged. They can also be configured to be sent to Slack.
Monitor the monitor
Since Pulsar Heartbeat monitors Pulsar, we must take into account that Pulsar Heartbeat itself can go down unplanned. We added an internal service that can send Heartbeat messages to a Dead Man’s Snitch service or any webhook-enabled Heartbeat monitoring service.

Want to try out Apache Pulsar?
The easiest way to get a Pulsar Heartbeat-enabled deployment of Apache Pulsar is with our free distribution, Luna Streaming. If you haven’t taken the plunge into Kubernetes yet, don’t worry—Luna Streaming gives you the option of deploying to its Kubernetes-in-a-box either locally or across a cluster. Try it out now!
We also encourage you to sign up for Astra Streaming, our fully managed Apache Pulsar service. We’ll give you access to its full capabilities entirely free through beta. See for yourself how easy it is to build modern data applications and let us know how we can make your experience even better.
Challenges to monitoring Apache Pulsar health
The Pulsar Heartbeat solution
What is Pulsar Heartbeat?
Pulsar Heartbeat Features and Capabilities
How Heartbeat monitors Pulsar
Pub-sub latency test
WebSocket test
Partitioned topic test
Broker monitor
Pulsar admin REST API monitor
Kubernetes deployment monitor
Test module features
Monitor multiple clusters
Geo-replication test
Pulsar Heartbeat Configuration
Installation and runtime options
Build and run as a binary executable
Docker
Kubernetes deployment and Helm chart
Prometheus alerting options
Alerting
Fault deduplication
Monitor the monitor
Want to try out Apache Pulsar?
More Technology
View All
Introducing the DataStax AI Terraform Module