Monitoring Cassandra Clusters in Kubernetes with Prometheus and Grafana
As your Kubernetes system grows, it becomes more taxing to manage your cluster including:
- Configuring all the cluster’s components
- Detecting anomalous conditions to prevent failures
- When failures occur, diagnosing the root cause quickly
- Optimizing performance and resource utilization
- Planning for future capacity requirements
Performing this level of management at Kubernetes-scale is no simple manual process - you need powerful monitoring tools so you know how your cluster is behaving. This is where Prometheus and Grafana come in.
Prometheus is a useful tool for capturing metrics. It is a mainstay for monitoring components of Kubernetes clusters. Grafana is a customizable metrics visualization tool that integrates well with Prometheus. Together, these two tools let you monitor and successfully manage complex Kubernetes clusters.

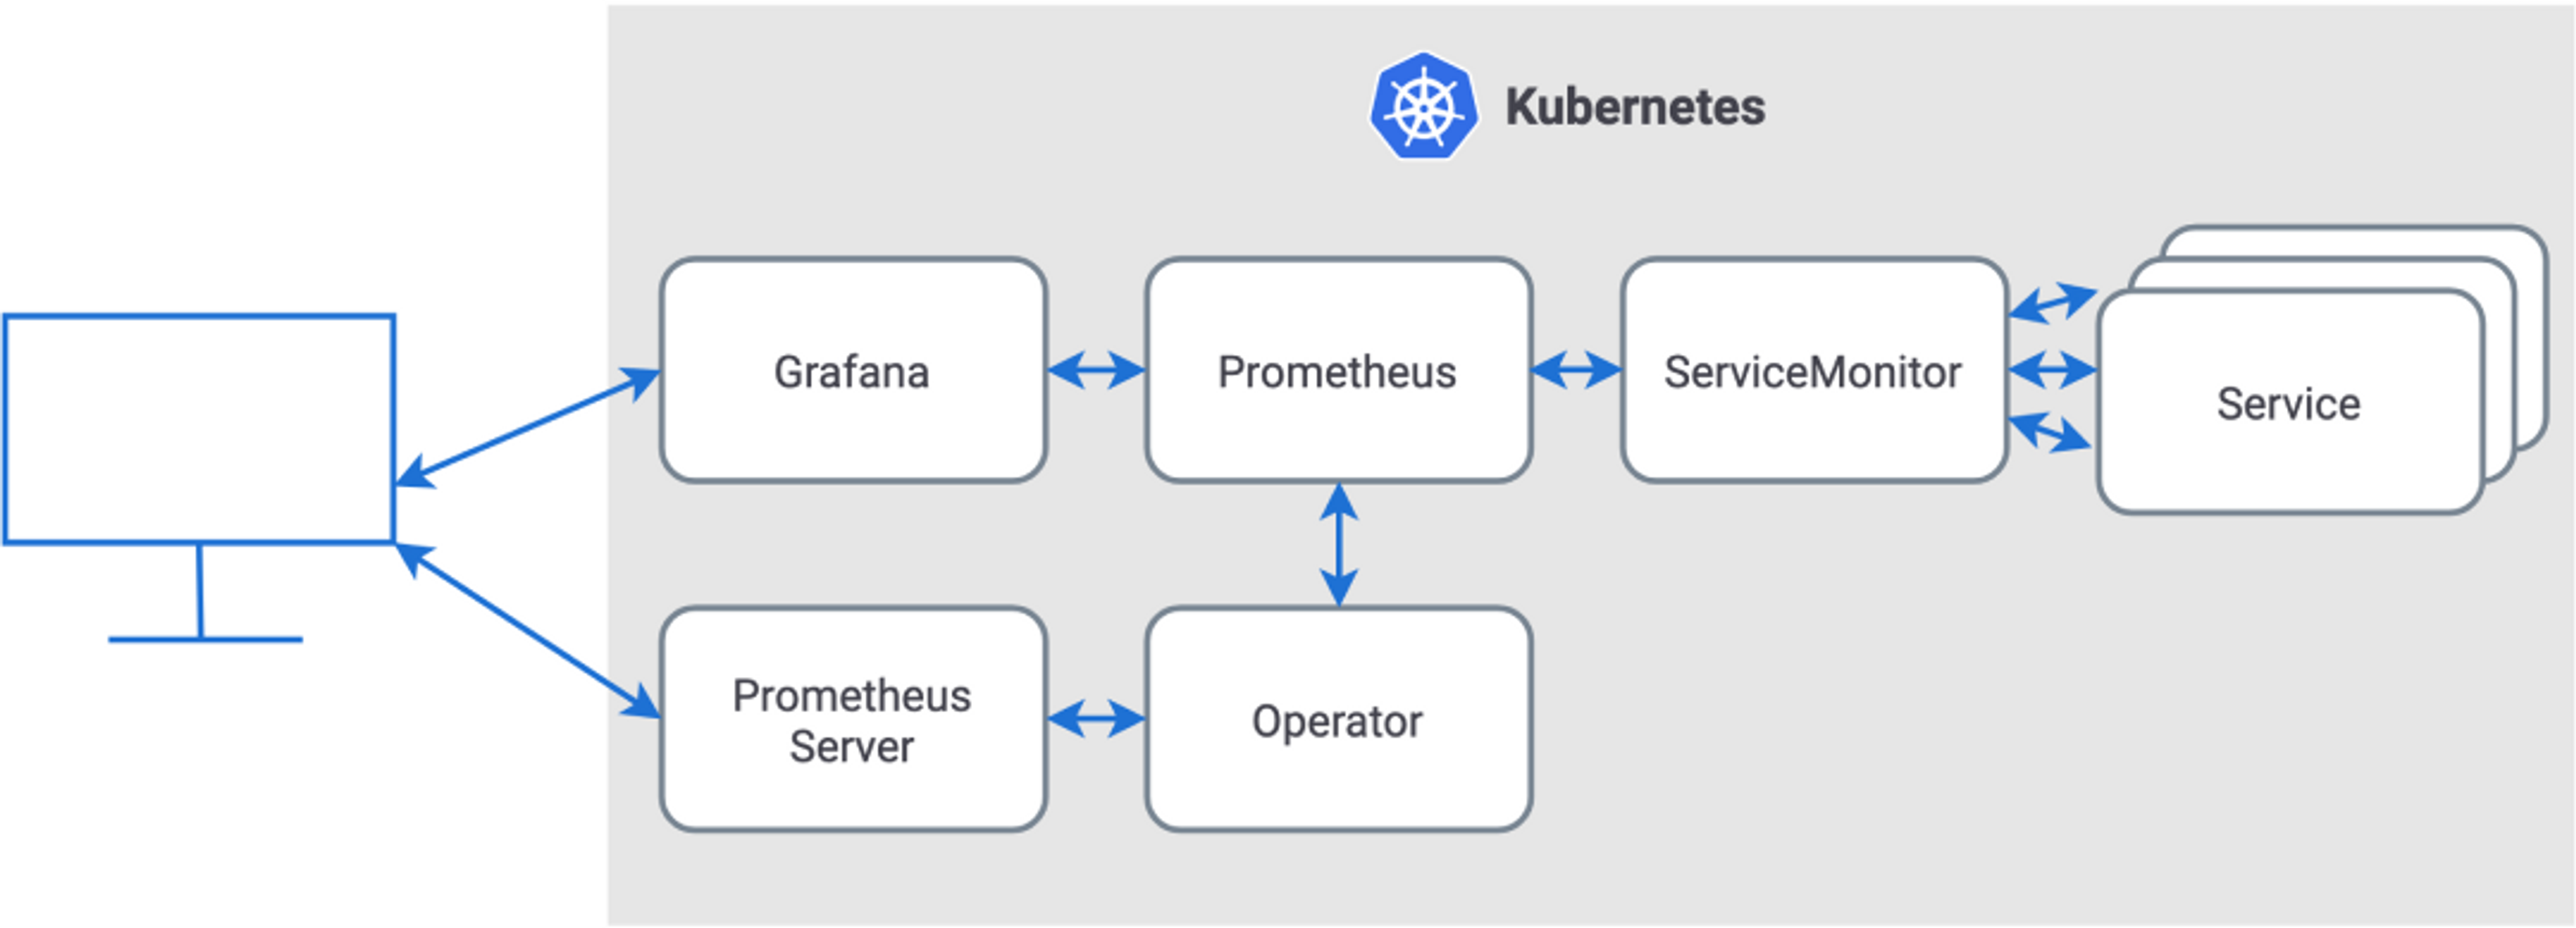
How Does Prometheus And Grafana Fit Into A Kubernetes Architecture?
Within a Kubernetes cluster, the job of Prometheus is to capture metrics from components of interest. Prometheus captures these metrics by “scraping” endpoints provided by the components.
Since many Kubernetes components include a service, you can use a Prometheus Custom Resource Definition (CRD), called a ServiceMonitor, to create an endpoint interface for Kubernetes services.
Grafana provides a set of browser-based visualizations for the metrics Prometheus collects. Grafana does this by querying Prometheus using PromQL, the Prometheus query language.
You can deploy both Prometheus and Grafana by installing the Prometheus Operator. This operator also adds the ServiceMonitor CRD to the Kubernetes environment.
Next: How Does Prometheus Work?How Does Prometheus Work?
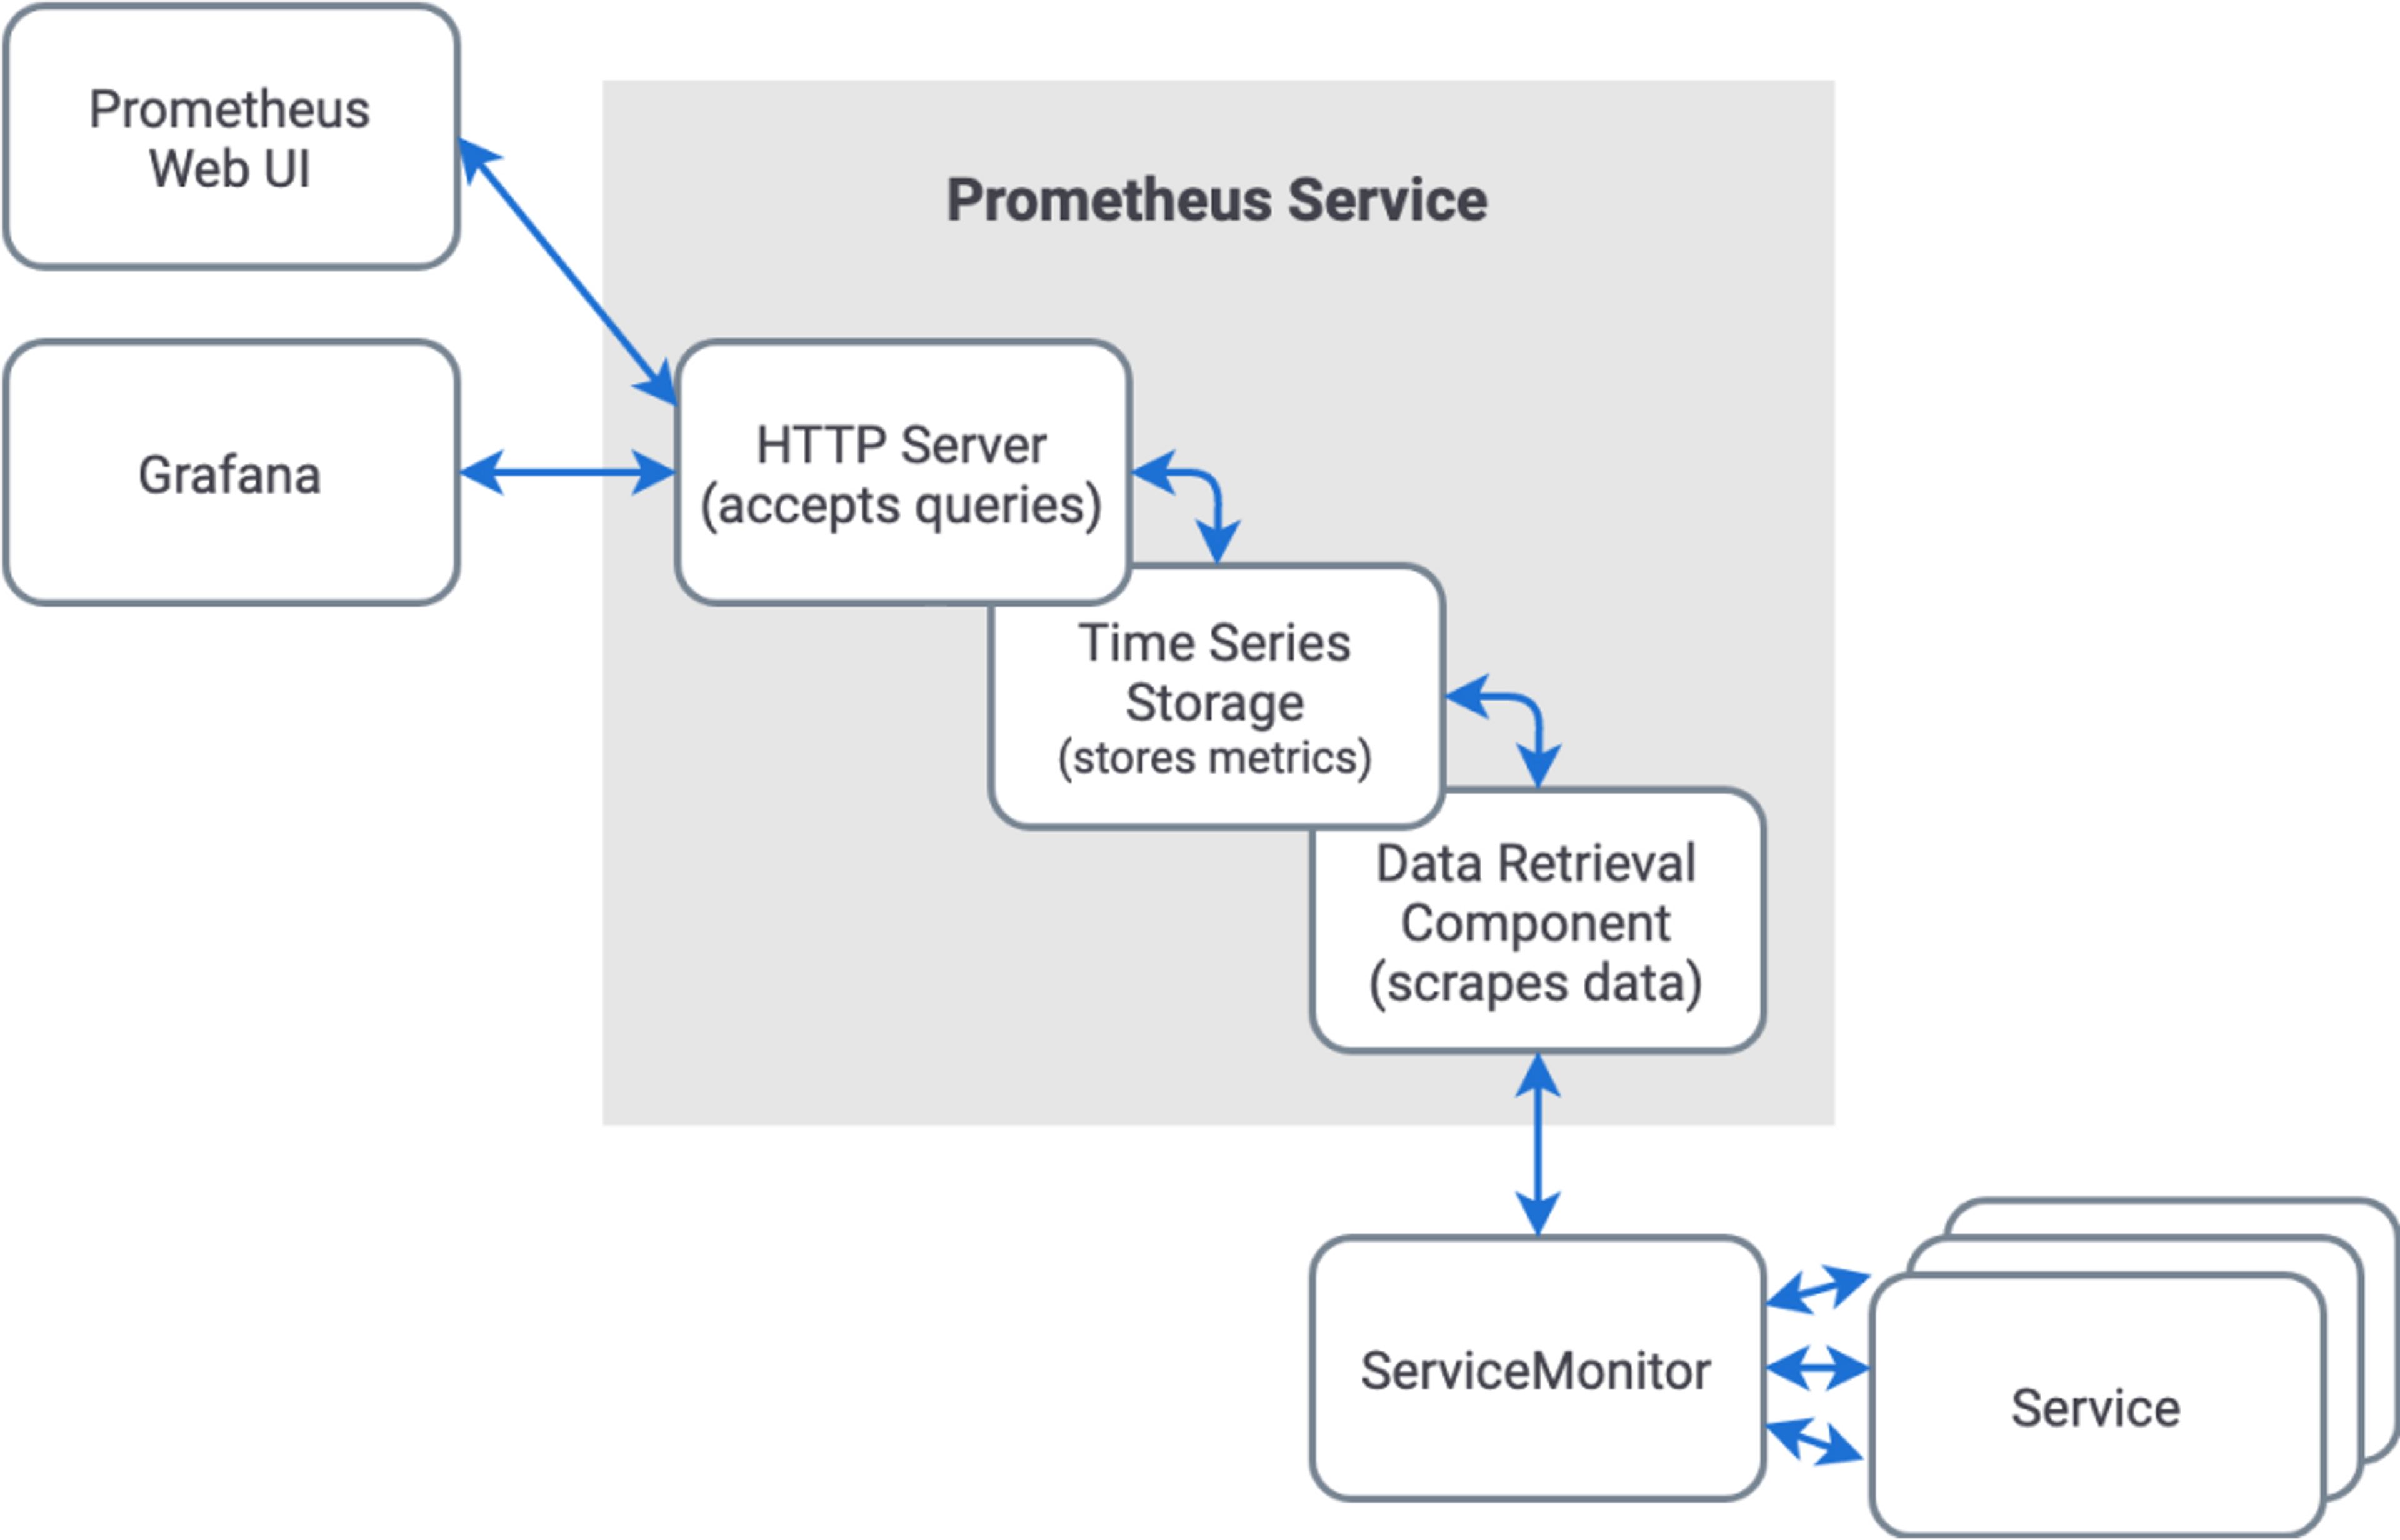
The Prometheus Server consists of three modules:
- The metrics capture component
- A time-series database
- The query server module
The metrics capture component “scrapes” endpoints to retrieve metrics. Prometheus allows you to specify and configure the list of endpoints it accesses. These endpoints present themselves as HTTP servers and usually have the name format of hostname/metrics. The ServiceMonitor, provided by the Prometheus Operator, connects to a Kubernetes service and presents the necessary HTTP server.
The time-series database stores the metrics retrieved by the metrics capture module.
The query server module provides access to the time-series database using PromQL as a query language. In addition to the query server, Prometheus also provides a web-based interface.
Prometheus also provides a browser-based UI for inspecting endpoints.
Note that Prometheus has a “pull-based” architecture (as opposed to a push-based approach). This architecture prevents Prometheus from being swamped with metrics being pushed by many endpoints.
Next: How do I view metrics in Grafana?

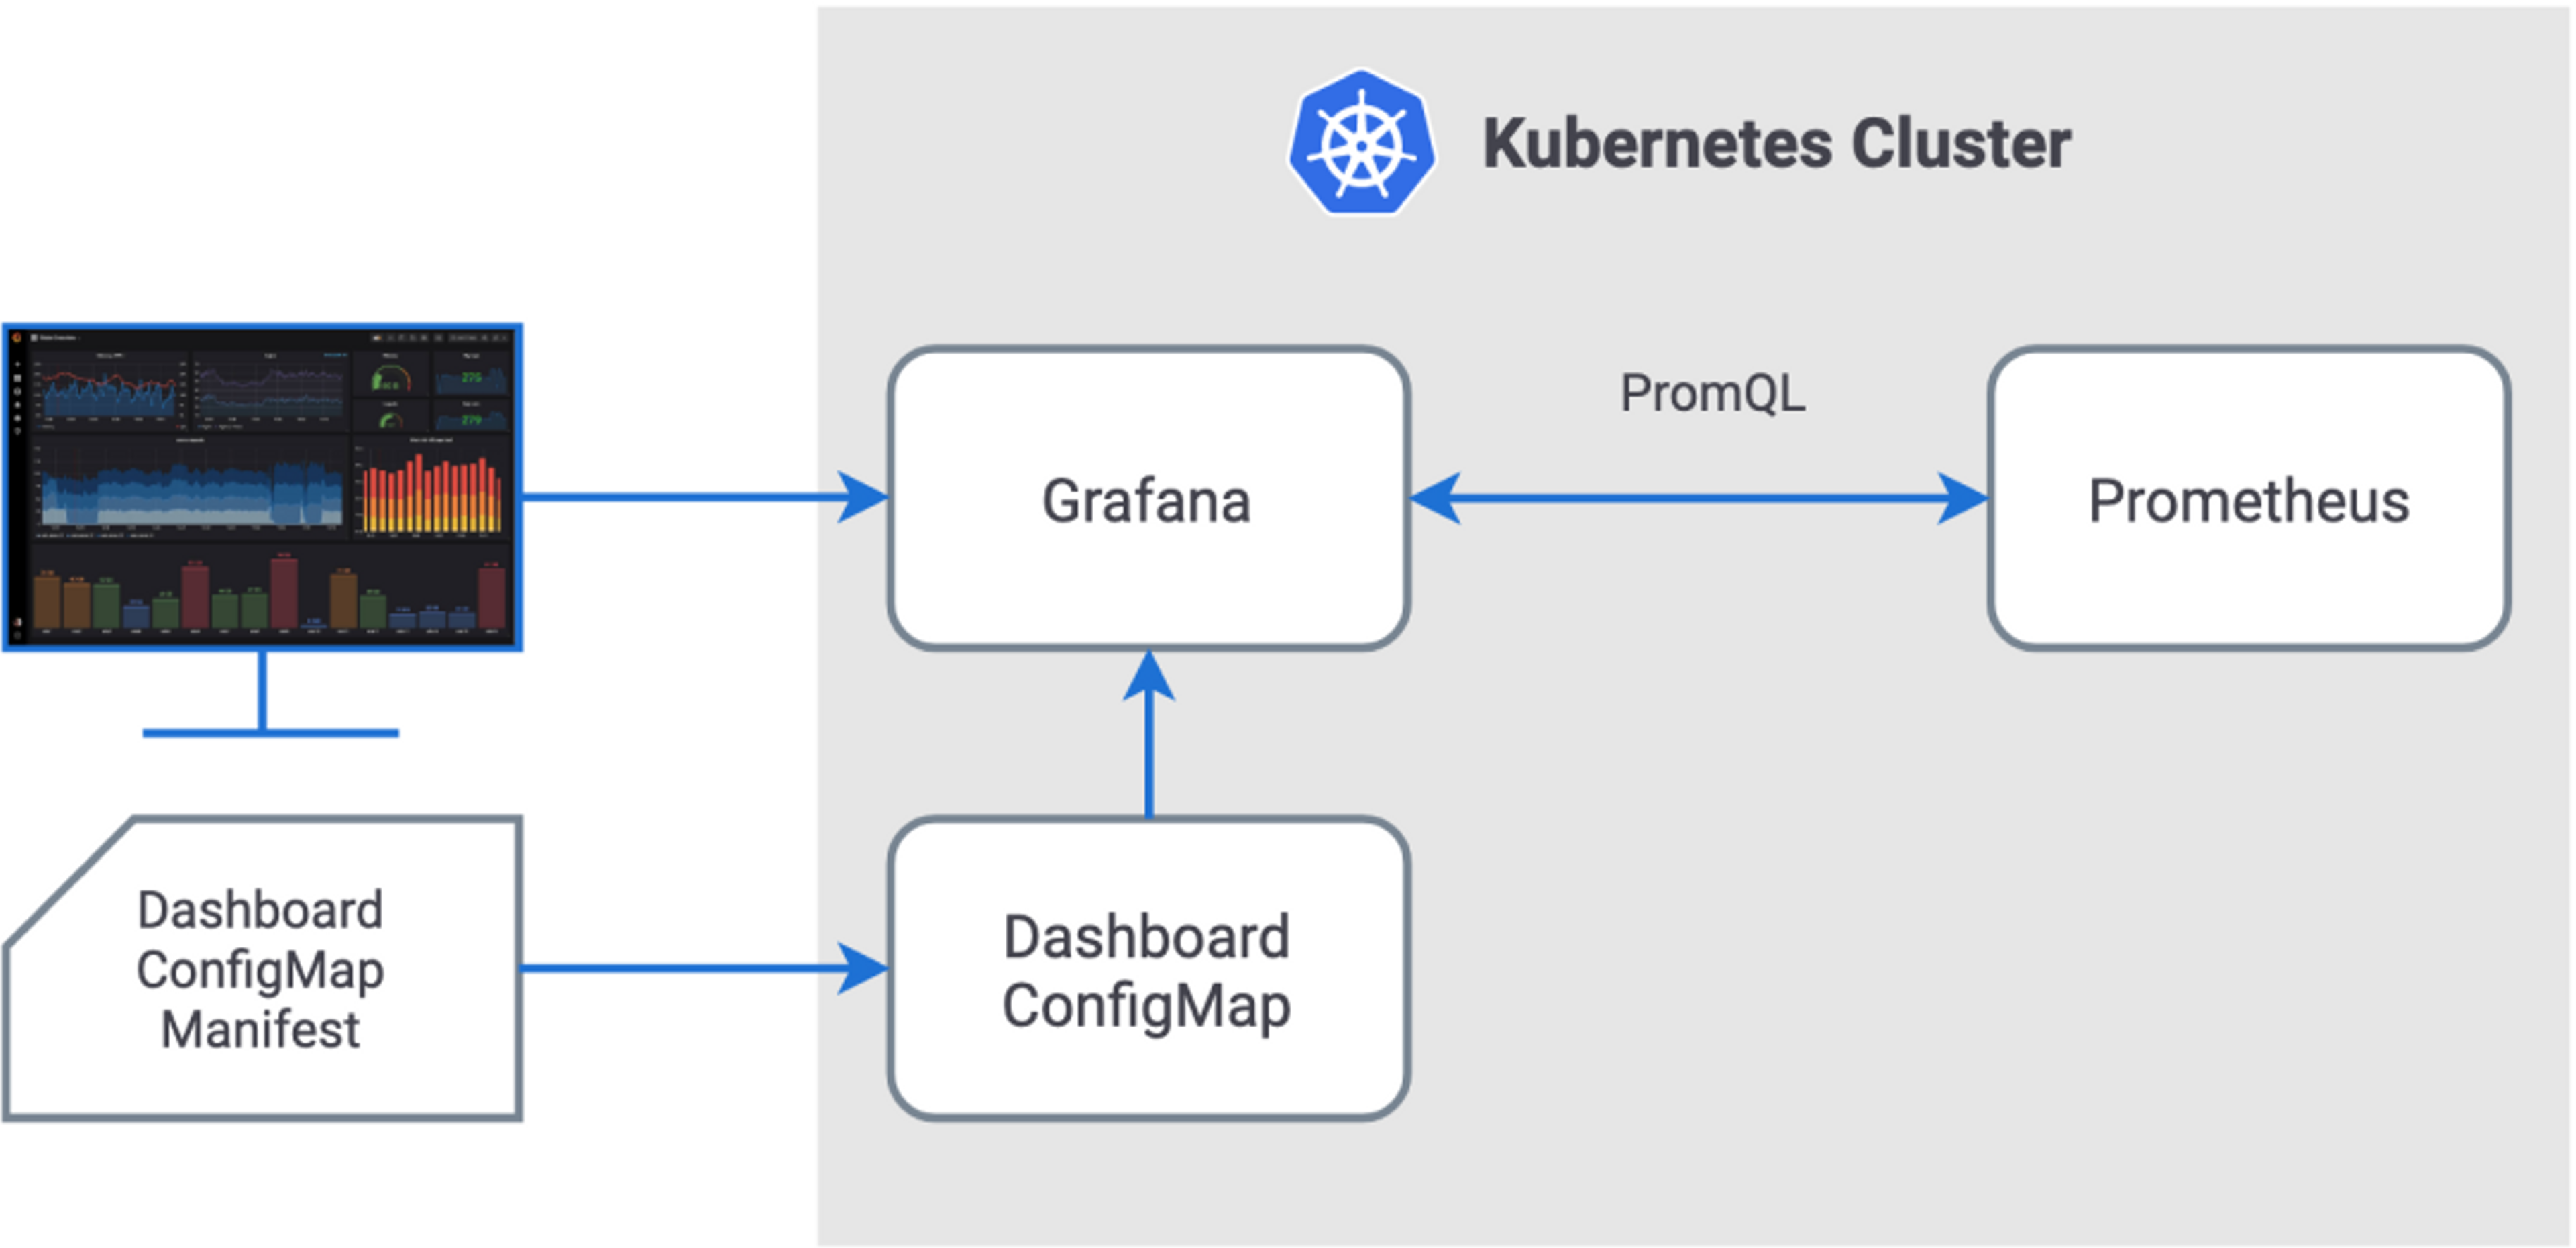
How Do I View Metrics In Grafana?
Grafana retrieves metrics from Prometheus (using PromQL) and presents these metrics in Dashboards. Grafana comes with some preconfigured Kubernetes dashboards, and you can also build your own. You configure dashboards by using a ConfigMap manifest file, which defines the dashboards, and then applying the manifest file to create the Kubernetes ConfigMap.
Next: Grafana DashboardsGrafana Dashboards
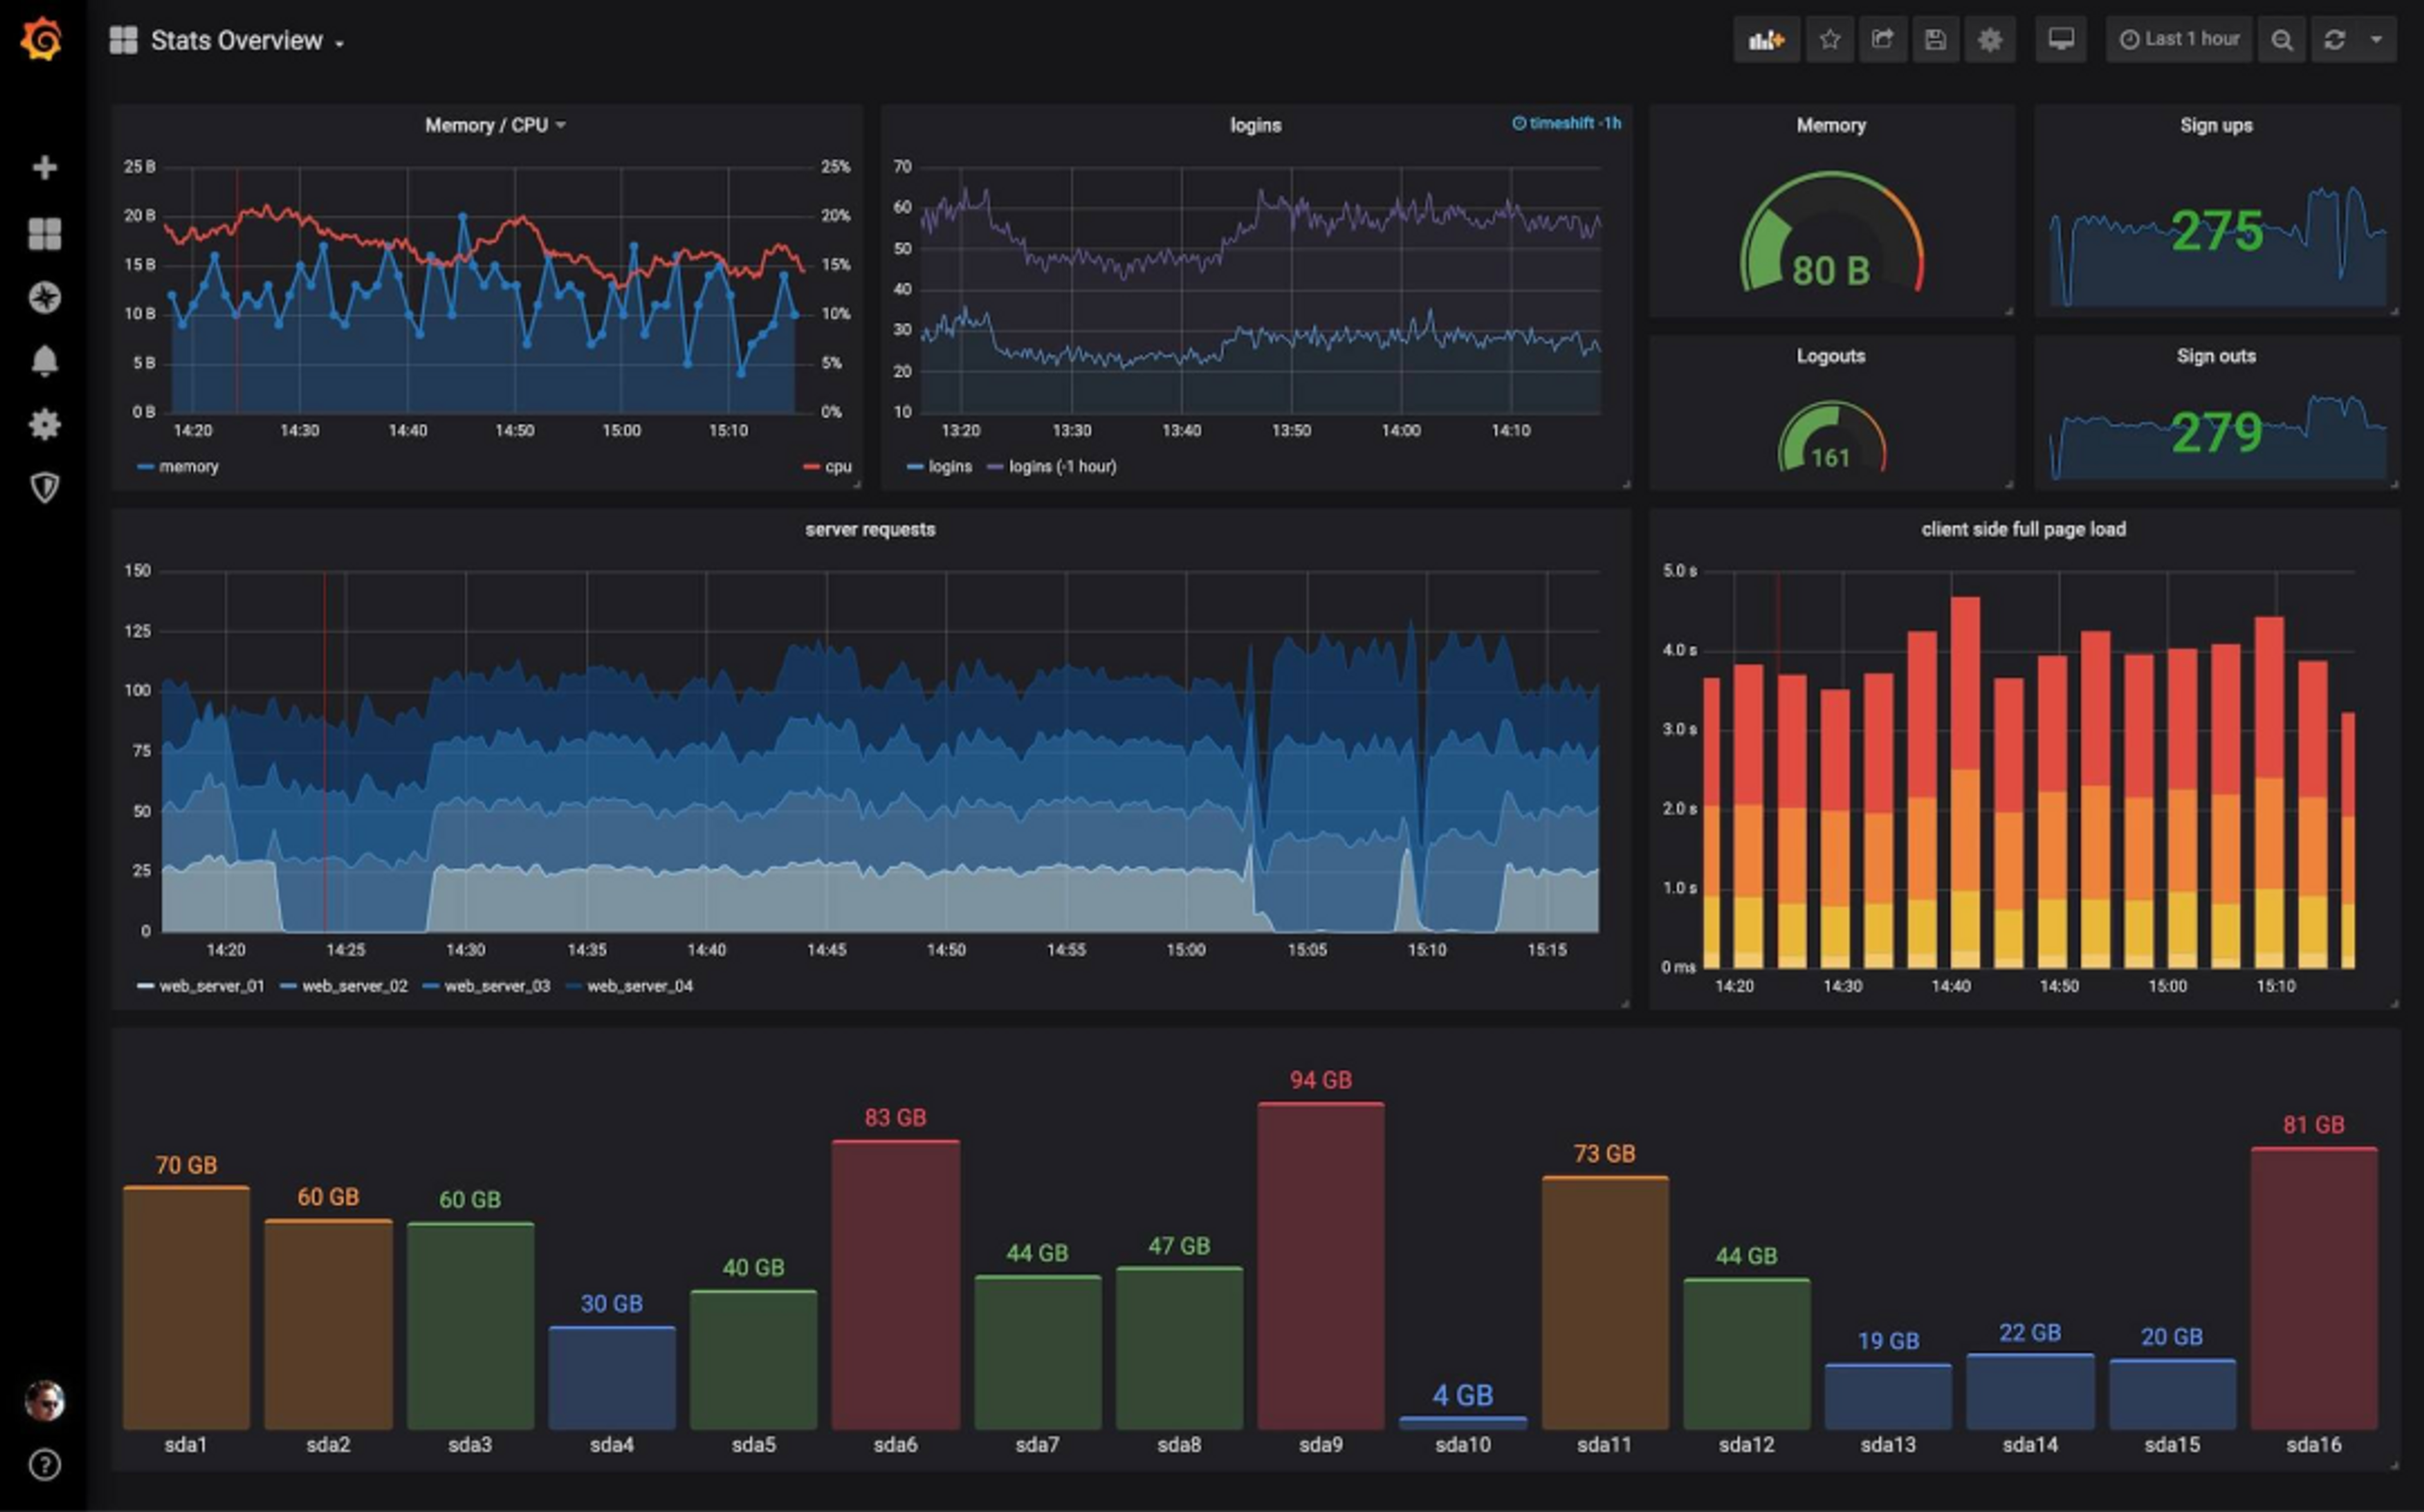
Grafana Dashboards consist of sets of panels for viewing specific metrics. The panels include counters, gauges and histograms.
If you look at some of the dashboard configuration files, you will see that configuring Grafana dashboards can be tedious and challenging. Fortunately, this is just one of the many things that K8ssandra does for you.

More Resources
Items related to Kubernetes


Monitoring Data
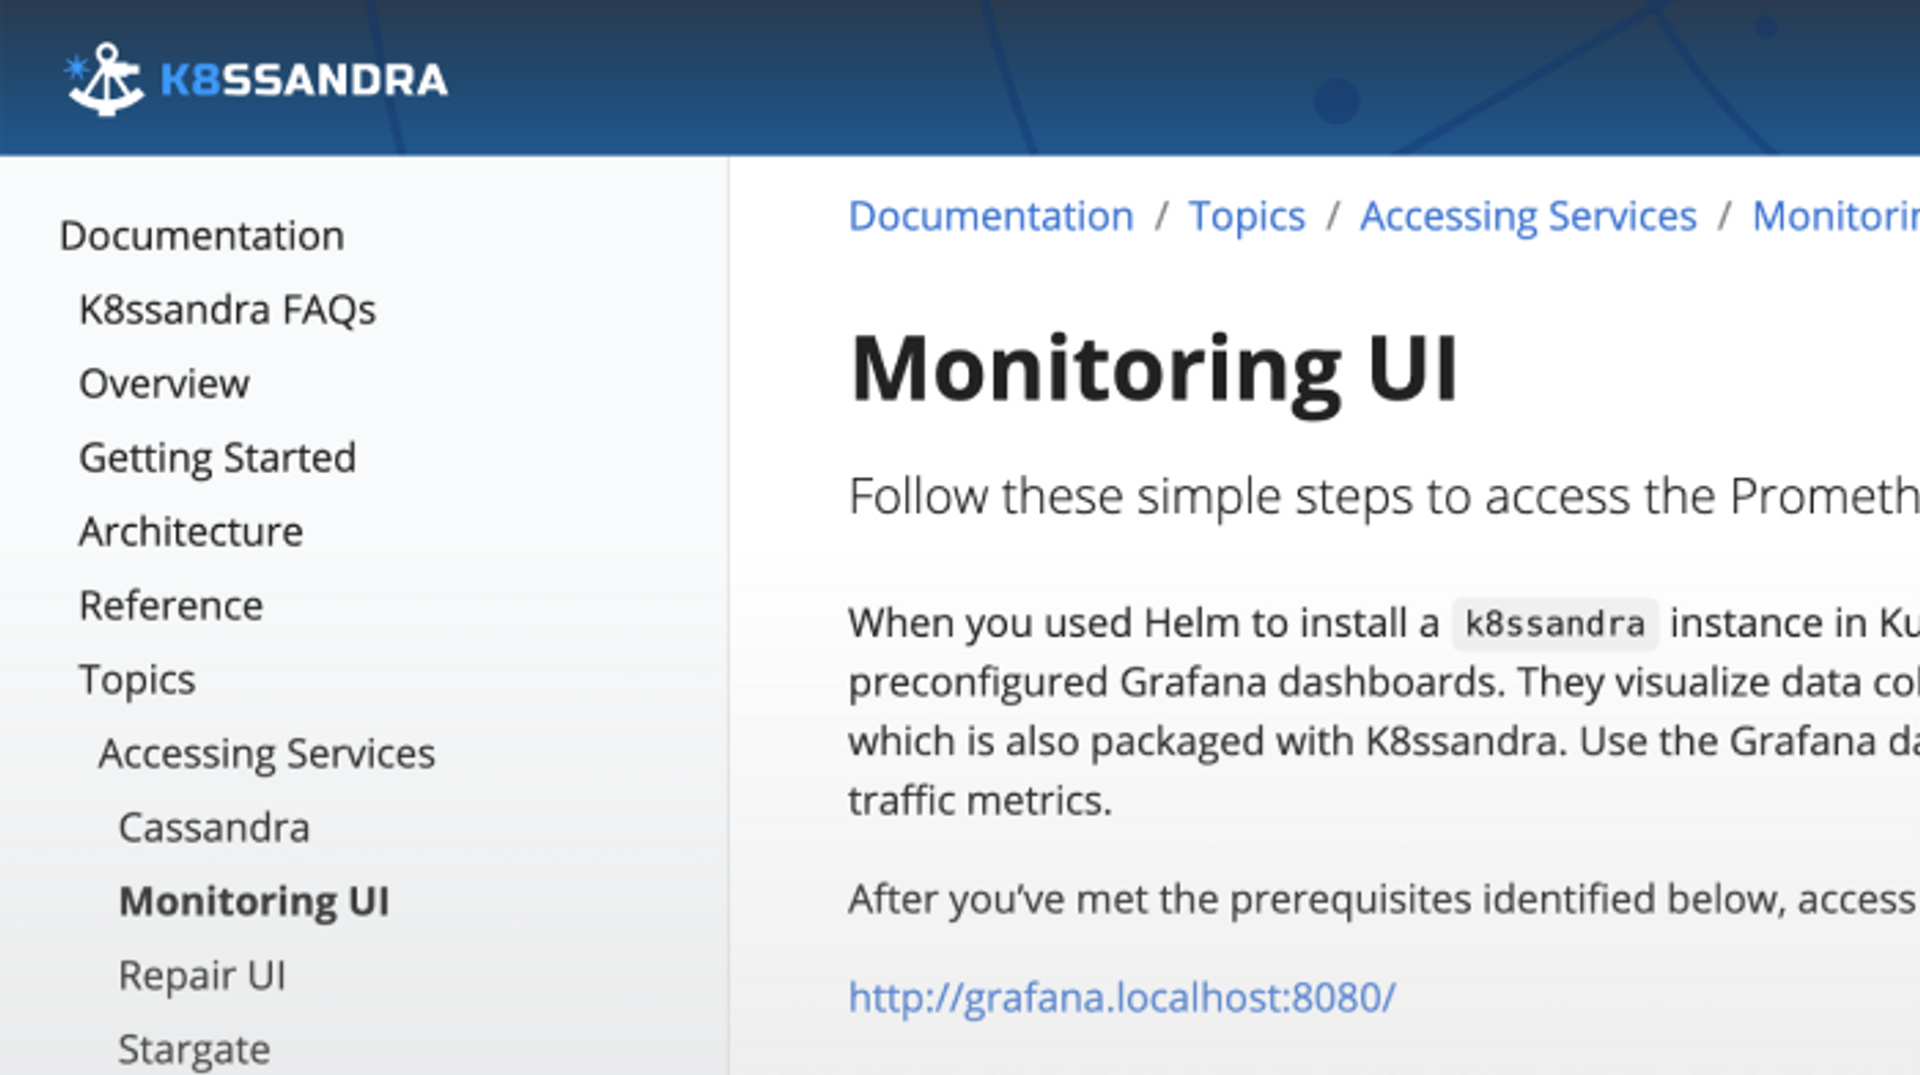
Follow these simple steps to access the Prometheus and Grafana monitoring interfaces.
Learn More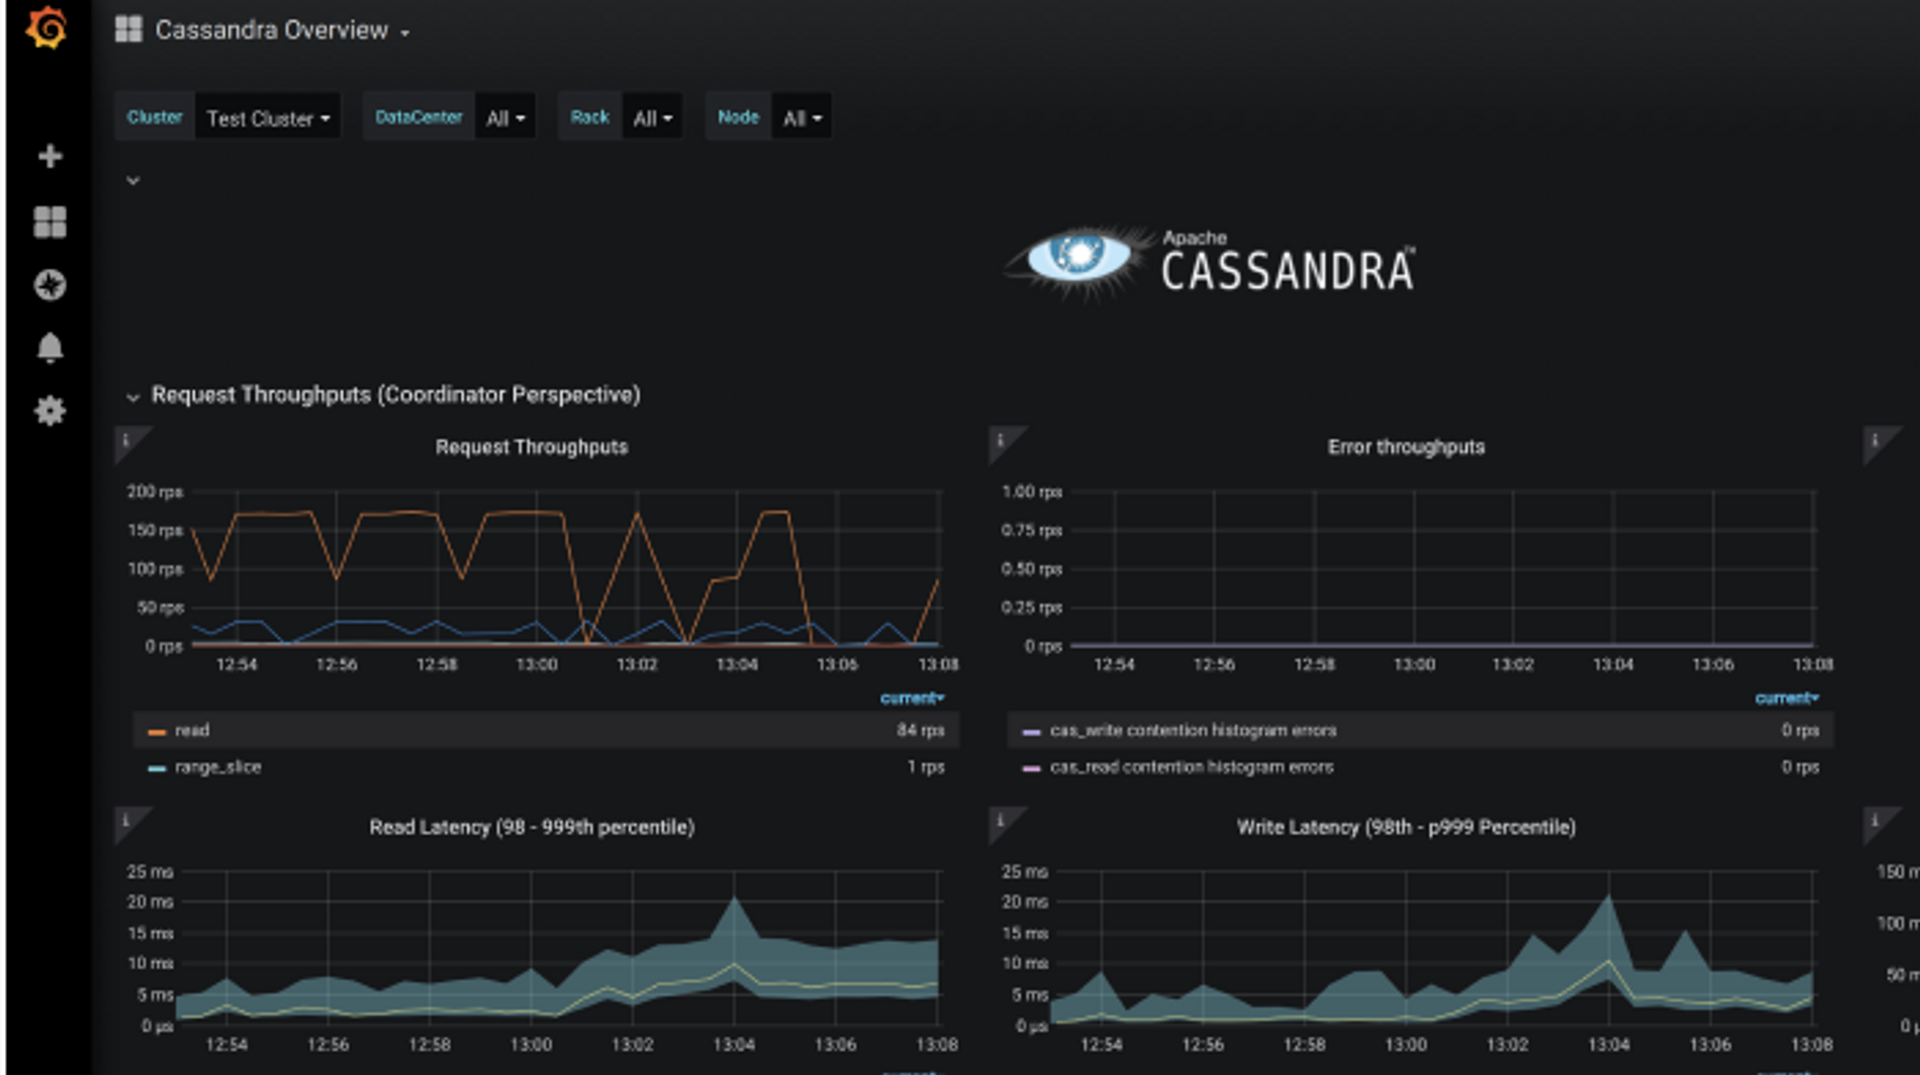
Monitoring Data
Follow these simple steps to access the Prometheus and Grafana monitoring interfaces.
Learn More